1. Modern taxonomy is about identifying clades
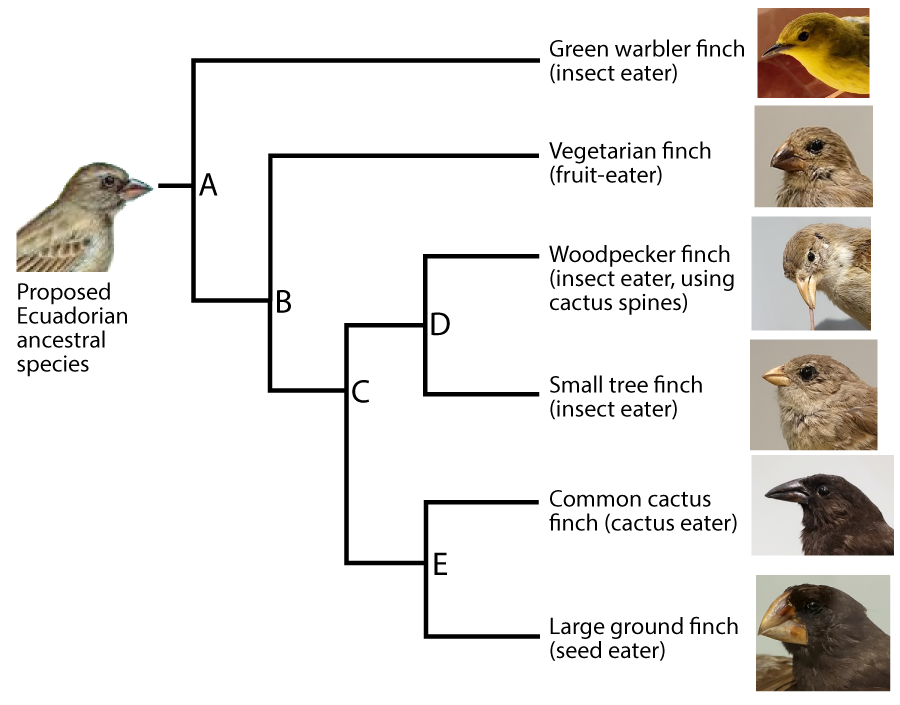
The branching diagram shown to the left is called a phylogenetic tree. Phylogeny is the study of evolutionary history and relationships among individuals or populations.

The species shown in this phylogenetic tree are among the most famous in biology. They’re Galapagos Finches, first identified by Charles Darwin in the early 1800s. The Galapagos are a group of volcanic islands in the Pacific Ocean, about 1000 km (600 miles) west of Ecuador. It’s thought that a small population of birds from Ecuador colonized the islands, which then evolved into over a dozen species.
In a very compact format, phylogenetic trees accomplish two things.
- First, they tell the evolutionary history of a group of species. For example, a glance at the phylogenetic tree for the Galapagos Finches shows how one species (A) is the common ancestor of the entire group. A speciation event caused “A” to split into two major lineages or lines of descent. One lineage led to the Green Warbler finch. The other led to all the species that are descended from “B.”
- Second, phylogenetic trees show us the kind of nested, hierarchical groupings of species that we looked at in the previous tutorial.
Identifying groups with a common ancestor is one of the most essential moves in modern taxonomy. A clade is a group of organisms that includes a common ancestor and all of its descendants. A clade can be a group of species, a single species, or a population within a species.
Clades can be nested within clades. Knowing that, let’s do some analysis of this phylogenetic tree. Answer the question below.
[qwiz]
[h]How many clades?
[q multiple_choice=”true”] How many clades are in this phylogenetic tree?
[c]IDEg[Qq][c]IDUg[Qq][c]IDYg[Qq][c]ID Ex
Cg==[Qq][f]IE5vLiBUaGVyZSYjODIxNztzIG9uZSBjb21tb24gYW5jZXN0b3IsIGJ1dCBtYW55IG1vcmUgY2xhZGVzLiBZb3UmIzgyMTc7bGwgZ2V0IGFub3RoZXIgY2hhbmNlIGF0IHRoaXMgcXVlc3Rpb24gbGF0ZXIuIEZvciBub3csIGtlZXAgcmVhZGluZyBiZWxvdy4=[Qq]
[f]IE5vLiBUaGVyZSBhcmUgNSBicmFuY2ggcG9pbnRzLCBidXQgbWFueSBtb3JlIGNsYWRlcy4gWW91JiM4MjE3O2xsIGdldCBhbm90aGVyIGNoYW5jZSBhdCB0aGlzIHF1ZXN0aW9uIGxhdGVyLiBGb3Igbm93LCBrZWVwIHJlYWRpbmcgYmVsb3cu[Qq]
[f]IE5vLiBUaGVyZSBhcmUgc2l4IGRlc2NlbmRhbnQgc3BlY2llcywgYnV0IG1hbnkgbW9yZSBjbGFkZXMuIFlvdSYjODIxNztsbCBnZXQgYW5vdGhlciBjaGFuY2UgYXQgdGhpcyBxdWVzdGlvbiBsYXRlci4gRm9yIG5vdywga2VlcCByZWFkaW5nIGJlbG93Lg==[Qq]
[f]IE5pY2UhIFRoZXJlIGFyZSAxMSBjbGFkZXMuIEtlZXAgcmVhZGluZyBiZWxvdy4=[Qq]
[/qwiz]
To help you understand how clades work, I’ve redrawn the diagram below and added shading so that the clades are easier to identify.
The clade that’s descended from species “A” is numbered as clade “1.” Because “A” is the common ancestor of all of the species shown in the diagram, clade 1 consists of all of the six species shown on the right, plus their common ancestor on the far left.
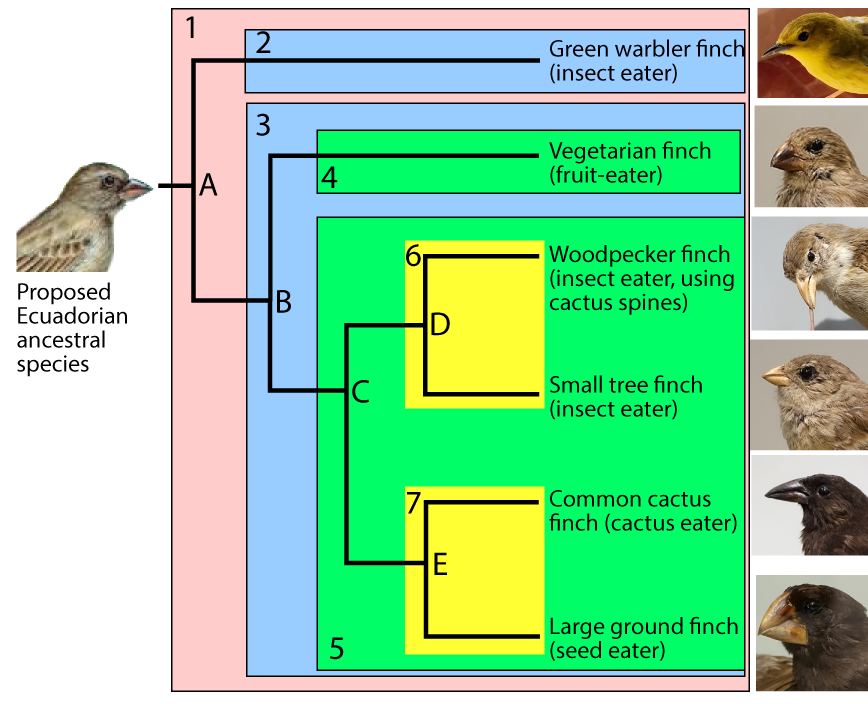
For any clade that consists of more than one species, the common ancestors are located at nodes. The nodes are labeled “A” through “E.” Because nodes are where speciation events occur, they’re also called branch points.
A speciation event at node “A” created two clades, “2” and “3.” A second speciation event at node “B” produced two more clades (“4” and “5.”). Another speciation event at “C” produced clades “6” and “7.” Speciations at nodes “D” and “E” produced additional clades, each consisting of a single species.
A big part of taxonomy involves identifying the clades that an organism belongs to. For example, the large ground finch is a member of 5 clades
- Its own species (the large ground finch)
- Clade 7
- Clade 5
- Clade 3, and
- Clade 1
Note that some clades are very specific, consisting of just one species. Others are more general. In the preceding example, the large ground finch clade is the most specific: it contains just one species. Clade 7 is slightly more general: it contains two species. Clade 3 includes 5 species.
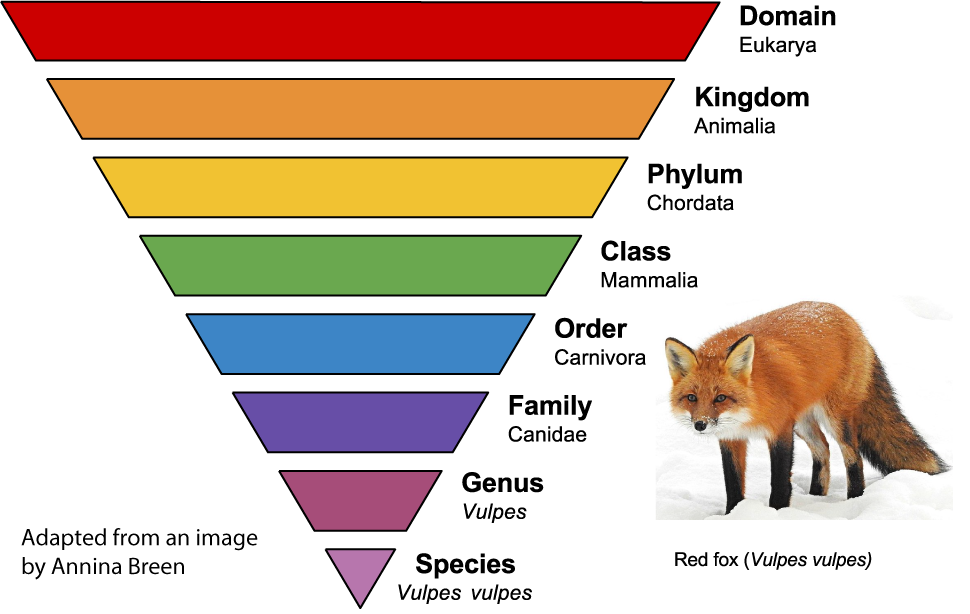 Let’s connect this to the hierarchical classification categories developed by Linnaeus. If biological classification is done correctly, then each taxon, within each category, should be a clade. That’s what we see in the example to the left.
All of the foxes within the genus Vulpes are a clade. That clade excludes other members of the dog family (the Canidae) such as wolves. Canidae is a clade that contains all members of the dog family (such as dogs, wolves, coyotes, and jackals) but excludes other carnivores (such as cats or bears). Similarly, the class Mammalia is a clade. All mammals, from kangaroos to whales, share a common ancestor. Other non-mammalian Chordates (such as fish or birds) are not part of the mammal clade.
Below, we’ll learn about how biologists identify clades. But before that, let’s consolidate what you read with flashcards and a quiz.
2. Phylogeny and Phylogenetic Trees Flashcards
[qdeck bold_text=”false” style=”width: 600px !important; min-height: 450px !important;” qrecord_id=”sciencemusicvideosMeister1961-Phylogeny and Phylogenetic Trees Flashcards”]
[h] Phylogeny and Phylogenetic Trees Flashcards
[q] Review from the last tutorial: The branch of biology concerned with classification is
[a] The branch of biology concerned with classification is taxonomy.
[q] A branching diagram like the one below is known as a _____________ ______.
[a] A branching diagram like the one below is known as a phylogenetic tree
[q] The study of evolutionary history and the relationships among individuals or populations is known as
[a] The study of evolutionary history and the relationships among individuals or populations is known as phylogeny.
[q] A group that consists of a common ancestor and all of its descendants is a ________.
[a] A group that consists of a common ancestor and all of its descendants is a clade.
[q] In the phylogenetic tree below, letters A, B, C, D, and E represent three things. What are they?
[a]In the diagram to the right
- The letters are branch points (where one species splits into two or more descendants).
- These branch points are also known as nodes.
- Finally, each node is where you find a clade’s common ancestors.
[q] A single line of descent (such as that from “p” to “r”) is known as a _______________.
[a]
A single line of descent is known as a lineage.
[q] If taxonomy is done correctly, then each taxon should be a _____________.
[a] If taxonomy is done correctly, then each taxon should be a clade.
[q]Define clade.
[a]A clade is a group that consists of an ancestor and all of its descendants.
[q]Define phylogeny.
[a]Phylogeny is the study of evolutionary history and the relationships among individuals or populations.
[x][restart]
[/qdeck]
3. Phylogeny and Phylogenetic Trees Quiz
[qwiz qrecord_id=”sciencemusicvideosMeister1961-Phylogeny and Phylogenetic Trees Quiz (v2.0)”]
[h]Phylogeny and Phylogenetic Trees
[i]
[q] All of the Galapagos finches descend from a common ancestor. That makes the birds below a [hangman]
[c]IGNsYWRl[Qq]
[q] The study of evolutionary history is called [hangman]
[c]IHBoeWxvZ2VueQ==[Qq]
[q] The diagram below says that all bears make up a [hangman].
[c]IGNsYWRl[Qq]
[q] In the diagram below, the shaded rectangles represent _______________. The letters represent common _______________. They’re also called _______________. And because they represent points where one lineage splits into two, they’re also called _______________ points.
[l] ancestors
[fx] No, that’s not correct. Please try again.
[f*] Great!
[l] branch
[fx] No. Please try again.
[f*] Great!
[l] nodes
[fx] No, that’s not correct. Please try again.
[f*] Correct!
[l] clades
[fx] No, that’s not correct. Please try again.
[f*] Great!
[q] The common ancestor of clade 6 is
[textentry single_char=”true”]
[c]IE Q=[Qq]
[f]IE5pY2Ugam9iISAmIzgyMjA7RCYjODIyMTsgaXMgdGhlIGNvbW1vbiBhbmNlc3RvciBvZiBjbGFkZSA2Lg==[Qq]
[c]IEVudGVyIHdvcmQ=[Qq]
[c]ICo=[Qq]
[f]IE5vLiBIZXJlJiM4MjE3O3MgYSBoaW50OiBUaGUgY29tbW9uIGFuY2VzdG9yIG9mIGNsYWRlIDcgaXMgJiM4MjIwO0UuJiM4MjIxOyBJZiB0aGF0JiM4MjE3O3MgdGhlIGNhc2UsIHRoZW4gd2hhdCYjODIxNztzIHRoZSBjb21tb24gYW5jZXN0b3Igb2YgY2xhZGUgNj8=[Qq]
[q] “B” is the common ancestor of which clade?
[textentry single_char=”true”]
[c]ID M=[Qq]
[f]IFdheSB0byBnbyEgJiM4MjIwO0ImIzgyMjE7IGlzIHRoZSBjb21tb24gYW5jZXN0b3Igb2YgY2xhZGUgMy4=[Qq]
[c]IEVudGVyIHdvcmQ=[Qq]
[c]ICo=[Qq]
[f]IE5vLiBIZXJlJiM4MjE3O3MgYSBoaW50OiAmIzgyMjA7QyYjODIyMTsgaXMgdGhlIGNvbW1vbiBhbmNlc3RvciBvZiBjbGFkZSA1LiBJZiB0aGF0JiM4MjE3O3MgdGhlIGNhc2UsIHRoZW4gJiM4MjIwO0ImIzgyMjE7IGlzIHRoZSBjb21tb24gYW5jZXN0b3Igb2Ygd2hpY2ggY2xhZGU/[Qq]
[q multiple_choice=”true”] How many clades are in this phylogenetic tree?
[c]IDEg[Qq][c]IDUg[Qq][c]IDYg[Qq][c]ID Ex
Cg==[Qq][f]IE5vLiBUaGVyZSYjODIxNztzIG9uZSBjb21tb24gYW5jZXN0b3IsIGJ1dCBtYW55IG1vcmUgY2xhZGVzLg==[Qq]
[f]IE5vLiBUaGVyZSBhcmUgNSBicmFuY2ggcG9pbnRzLCBidXQgbWFueSBtb3JlIGNsYWRlcy4=[Qq]
[f]IE5vLiBUaGVyZSBhcmUgc2l4IGRlc2NlbmRhbnQgc3BlY2llcywgYnV0IG1hbnkgbW9yZSBjbGFkZXMu[Qq]
[f]IE5pY2UhIFRoZXJlIGFyZSAxMSBjbGFkZXMu[Qq]
[q] A diagram like the one shown below is a [hangman] tree.
[c]IHBoeWxvZ2VuZXRpYw==[Qq]
[f]IEdyZWF0IQ==[Qq]
[q] A line of descent from an ancestor to its descendants (which would include “p” through “r” below”) is known as a [hangman].
[c]IGxpbmVhZ2U=[Qq]
[f]IEdyZWF0IQ==[Qq]
[q] In the diagram below, “A” is the [hangman] [hangman] of all of the other species in this phylogenetic tree.
[c]IGNvbW1vbg==[Qq]
[f]IEdyZWF0IQ==[Qq]
[c]IGFuY2VzdG9y[Qq]
[f]IEdyZWF0IQ==[Qq]
[q]Letters “A,” “B,” and “C” can also be thought of as [hangman] points. They’re also called [hangman]. These are points where [hangman] events occurred.
[c]YnJhbmNo[Qq]
[c]bm9kZXM=[Qq]
[c]c3BlY2lhdGlvbg==[Qq]
[/qwiz]
4. Phylogenetic trees are built by identifying shared derived features
The phylogenetic tree below shows relationships among seven different vertebrate taxa and one non-vertebrate. Here are a few points to note before we deepen our analysis.
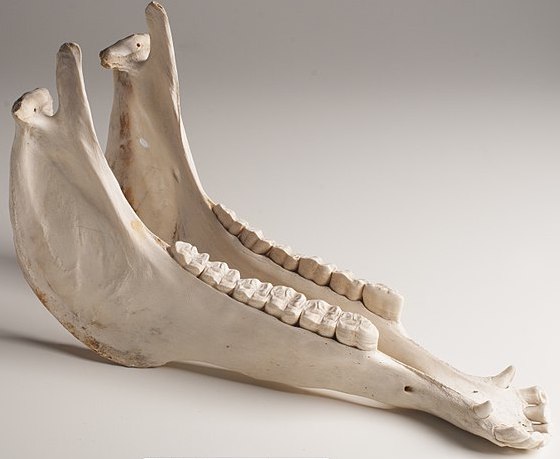
- A vertebrate is an animal with a backbone or a vertebral column. You’re a vertebrate. So are all mammals, fish, amphibians, reptiles, and birds.
A fish’s vertebral column (backbone) - The tree includes one non-vertebrate species — the hagfish. Hagfish are closely related to vertebrates but lack a key vertebrate feature: a hinged jaw. In the context of this phylogenetic tree, that makes hagfish the outgroup. Including them in the tree helps us to better define the ingroup (the clade that we’re analyzing).
Note that you can scroll the text below the phylogenetic tree so that you can look at the tree as you read the text.

How do we know that the vertebrates are a clade? In this case, the evidence is from anatomy (body structure). All vertebrates have a boney jaw. In this tree, the jaw is indicated by the red dot that’s to the left of letter “B.”
A characteristic that’s used to classify the members of a clade is called a shared derived feature. The word “derived” means “marked by a character…. not present in the ancestral form” (Merriam Webster). In the case of vertebrates, the clade consists of all the species that have a jaw. Species outside this clade — such as the hagfish — lack a jaw.
Here are a few of the other shared, derived features that define some of the other clades in this tree.
- Lungs and four limbs define the clade which includes frogs, lizards, alligators, robins, rats, and gorillas. This clade, because it consists of animals that have four limbs, is known as the tetrapods (the link, like the ones below, opens in a new tab).
- A gizzard is a specialized stomach that’s used for grinding food. Having a gizzard unites the robin and alligator within a clade known as the archosaurs.
- Fur and mammary glands (for making milk) unite the rat and gorilla within the mammal clade.
Features that the members of a clade share, but which are also shared by larger, more inclusive clades are called ancestral features. For example, we just mentioned that the clade that includes “G” and its descendants (rats and gorillas) is the mammal clade. An ancestral feature of the mammal clade would be “claws or nails.” Every mammal has this trait, but it’s not useful in defining the mammal clade, because it’s found in other organisms outside the clade (such as birds and alligators).
MISCONCEPTION ALERT: In a horizontally organized phylogenetic tree, like the one above, the vertical arrangement of the taxa says nothing about how closely related these taxa are. For example, a frog is no more closely related to a lizard than it is to a gorilla. That’s because the lineages in a phylogenetic tree can rotate around the nodes. A useful mental trick is to think of them as a mobile sculpture, with the root attached to the ceiling.

In other words, these two phylogenetic trees are equivalent.
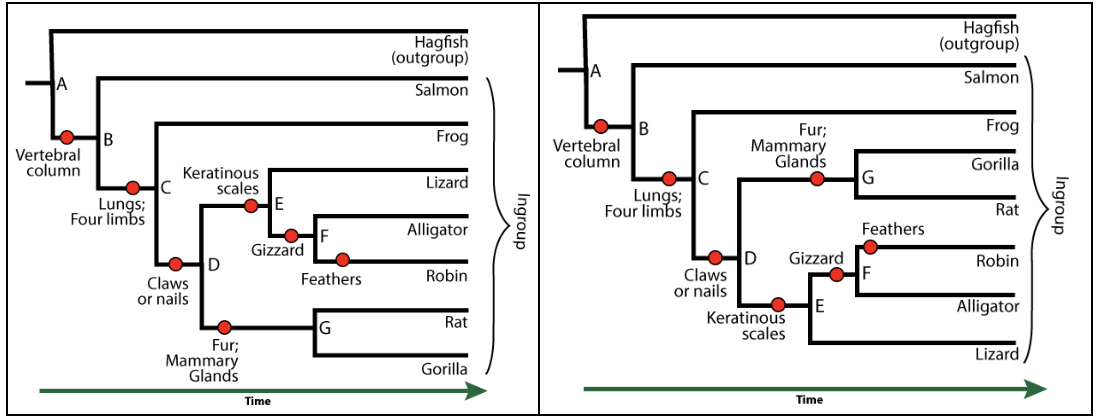
Note that this is true regardless of the orientation. If the tree were oriented vertically, then the horizontal arrangement would be the one to ignore.
The basic idea is this: in a phylogenetic tree, you can’t identify the closeness of relationships between taxa by who’s next to whom. You can tell by moving back in time and finding the most recent common ancestor. Alligators and robins, for example, have a common ancestor at node “F.” Alligators and lizards have a common ancestor at “E.” Because the ancestor between robins and alligators is more recent than the common ancestor between alligators and lizards, you can conclude that alligators and robins are more closely related than alligators and lizards.
5. Flashcards: Using Traits to Trace Phylogeny
[qdeck bold_text=”false” style=”width: 600px !important; min-height: 450px !important;” qrecord_id=”sciencemusicvideosMeister1961-Using traits to trace phylogeny (v2.0)”]
[h]Using traits to trace phylogeny
[q]A characteristic that’s used to identify the members of a clade is a ___________.
[a]A characteristic that’s used to identify the members of a clade is a shared derived feature.
[q]A characteristic shared by members of a clade, but also shared by larger, more inclusive clades, is a(n) ______________.
[a]A characteristic shared by members of a clade, but also shared by larger, more inclusive clades, is an ancestral feature.
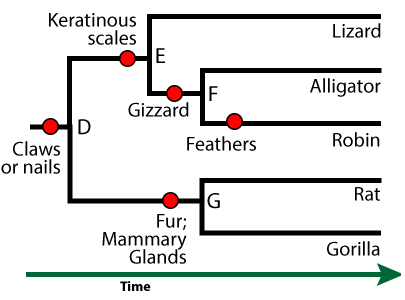
[q]In the phylogenetic tree below, keratinous scales (at “E”) are a(n) __________________ of the clade that includes lizards, alligators, and robins.
[a]Keratinous scales (at “E”) are a shared derived feature of the clade that includes lizards, alligators, and robins.
[q]In the phylogenetic tree below, claws or nails (at “D”) are a(n) __________________ of the clade that includes lizards, alligators, and robins.
[a]Claws or nails (at “D”) are an ancestral feature of the clade that includes lizards, alligators, and robins.
[q]In the phylogenetic tree below, the species that is most closely related to the polar bear is the ___________. Justify your answer.
[a]The species that is most closely related to the polar bear is the brown bear. That’s because the two share the most recent common ancestor.
[q]Why is it incorrect to say that the Giant Panda is most closely related to the Spectacled Bear?
[a]On a phylogenetic tree, closeness is about how recently two taxa share a common ancestor, not who’s next to whom. The giant panda’s most recent common ancestor with the spectacled bear is “A.” That means that the Giant Panda is equally distantly related to every other bear on the tree.
[/qdeck]
6. Challenge: Build a phylogenetic tree!
To understand how phylogenetic trees work, it helps to build one.
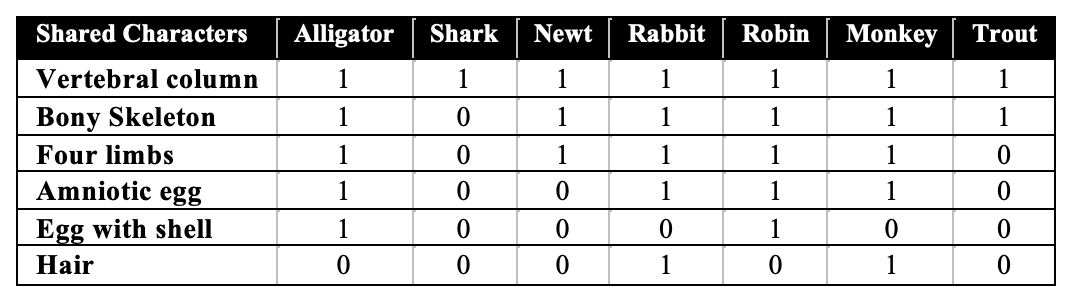
The table above is called a character table. In this context, a character is any quantifiable, inherited trait. A “1” means that the trait is present. “0” means that it’s absent.
When species share many characters, then they’re considered to be closely related. If they share very few characters, then they’re more distantly related. Take a look at the shark. Note that it shares the character of having a vertebral column with all of the other animals in the chart, but nothing else. That’s evidence that the shark can be classified as a more distant relation. Remember that, and use it in the exercise below.
Think of this as a puzzle. Don’t worry about getting the right answer right away. Use trial and error. The feedback will guide you to the solution.
One character listed in the table above might not be familiar to you. An amniotic egg is a complex egg found in birds, reptiles, and mammals (as opposed to the much simpler eggs found in fish and amphibians).
[qwiz qrecord_id=”sciencemusicvideosMeister1961-Challenge: Build a Phylogenetic tree (v2.0)”]
[h] Challenge: Build a Phylogenetic tree
[i]Motivational Haiku
It’s like a puzzle
Feel free to experiment
Soon you will succeed!
[q labels = “top”]Based on the table, organize these animals into a phylogenetic tree. Place shared derived traits above the red lines. Place the animals on the top.
[l]alligator
[fx] No. Please try again.
[f*] Correct!
[l]amniotic egg
[fx] No, that’s not correct. Please try again.
[f*] Good!
[l]bony skeleton
[fx] No. Please try again.
[f*] Excellent!
[l]four limbs
[fx] No. Please try again.
[f*] Correct!
[l]egg w/ shell
[fx] No, that’s not correct. Please try again.
[f*] Good!
[l]hair
[fx] No. Please try again.
[f*] Correct!
[l]newt
[fx] No. Please try again.
[f*] Excellent!
[l]rabbit
[fx] No. Please try again.
[f*] Correct!
[l]shark
[fx] No. Please try again.
[f*] Good!
[l]trout
[fx] No. Please try again.
[f*] Correct!
[l]vertebral column
[fx] No. Please try again.
[f*] Correct!
[q multiple_choice=”true”]Based on the phylogenetic tree below, which of the following statements is true?
[c]VGhlIG5ld3QmIzgyMTc7cyBjbG9zZXN0IHJlbGF0aXZlIGlzIHRoZSByYWJiaXQu[Qq]
[f]Tm8uIFJlbWVtYmVyIHRoYXQgaW4gYSBwaHlsb2dlbmV0aWMgdHJlZSwgdGhlIGJyYW5jaGVzIGNhbiByb3RhdGUgYXJvdW5kIGFueSBub2RlLiBJZiB5b3Ugcm90YXRlZCB0aGUgYW1uaW90ZXMsIHRoZW4gdGhlIGNoaWNrZW4gd291bGQgc2hvdyB1cHMgbmV4dCB0byB0aGUgbmV3dC4=[Qq]
[c]VGhlIG5ld3QgaXMgY2xvc2VyIHRvIHRoZS BhbGxpZ2F0b3IgdGhhbiB0aGUgdHJvdXQu[Qq]
[f]RXhjZWxsZW50LiBUaGUgbmV3dCBoYXMgYSBtb3JlIHJlY2VudCBjb21tb24gYW5jZXN0b3Igd2l0aCB0aGUgYWxsaWdhdG9yIHRoYW4gd2l0aCB0aGUgdHJvdXQu[Qq]
[q multiple_choice=”true”]Which of the following is the shared derived trait that unites rabbits, monkeys, alligators, and chickens into a single clade?
[c]SGFpciBhbmQgYW4gZWdnIHdpdGggYSBoYXJkIHNoZWxsLg==[Qq]
[f]Tm8uIEhhaXIgaXMgYSBzaGFyZWQgZGVyaXZlZCB0cmFpdCBvZiBtYW1tYWxzIChpbmNsdWRpbmcgcmFiYml0cyBhbmQgbW9ua2V5cykuIEFuIGVnZyB3aXRoIGEgaGFyZCBzaGVsbCBpcyBhIHNoYXJlZCBkZXJpdmVkIHRyYWl0IG9mIHRoZSBjbGFkZSB0aGF0IGluY2x1ZGVzIGFsbGlnYXRvcnMgYW5kIGNoaWNrZW5zLiBXaGF0JiM4MjE3O3MgdGhlIHNoYXJlZCBkZXJpdmVkIHRyYWl0IG9mIHJhYmJpdHMsIG1vbmtleXMsIGFsbGlnYXRvcnMsIA==YW5kIGNoaWNrZW5zPw==[Qq]
[c]SGF2aW5nIGZvdXIgbGltYnM=[Qq]
[f]Tm8uIEhhdmluZyBmb3VyIGxpbWJzIGlzIGFuIGFuY2VzdHJhbCB0cmFpdCBvZiByYWJiaXRzLCBtb25rZXlzLCBhbGxpZ2F0b3JzLCBhbmQgY2hpY2tlbnMuIEZpbmQgYSBzaGFyZWQgZGVyaXZlZCB0cmFpdCB0aGF0IHVuaXRlcyByYWJiaXRzLCBtb25rZXlzLCBhbGxpZ2F0b3JzLCBhbmQgY2hpY2tlbnMgd2l0aGluIGEgc2luZ2xlIGNsYWRlLg==[Qq]
[c]QW4gYW1uaW 90aWMgZWdn[Qq]
[f]TmljZS4gQW4gYW1uaW90aWMgZWdnIGlzIGEgc2hhcmVkIGRlcml2ZWQgdHJhaXQgdGhhdCB1bml0ZXMgcmFiYml0cywgbW9ua2V5cywgYWxsaWdhdG9ycywgYW5kIGNoaWNrZW5zIHdpdGhpbiBhIHNpbmdsZSBjbGFkZS4=[Qq]
[c]QSB2ZXJ0ZWJyYWwgY29sdW1uLg==[Qq]
[f]Tm8uIEhhdmluZyBhIHZlcnRlYnJhbCBjb2x1bW4gaXMgdGhlIHNoYXJlZCBkZXJpdmVkIHRyYWl0IG9mIGFsbCB2ZXJ0ZWJyYXRlcy4gSXQmIzgyMTc7cyBhbiBhbmNlc3RyYWwgdHJhaXQgb2YgcmFiYml0cywgbW9ua2V5cywgYWxsaWdhdG9ycywgYW5kIGNoaWNrZW5zLiBGaW5kIGEgc2hhcmVkIGRlcml2ZWQgdHJhaXQgdGhhdCB1bml0ZXMgcmFiYml0cywgbW9ua2V5cywgYWxsaWdhdG9ycywgYW5kIGNoaWNrZW5zIHdpdGhpbiBhIHNpbmdsZSBjbGFkZS4=[Qq]
[/qwiz]
7. Evidence for Tracing Phylogeny
 7a. Evidence from Morphology/Anatomy
In the phylogenetic trees that we’ve been discussing, the shared derived features for organizing the tree into clades have been based on morphology (the study of body structure). A slightly more specific term that’s almost identical to morphology is anatomy (the study of the structure of organisms). Different sources will use either term (or both).
In terms of phylogeny and classification, the important point is that using morphological or anatomical characteristics, you can look at a group of organisms and ask yourself questions like “Do they have fur? Do they have feathers?” Your answers would enable you to construct a phylogenetic tree.
Note that for one category of organisms — extinct species — anatomical or morphological data is all we have. For example, should Archaeopteryx be classified as a bird or a dinosaur?
|
|
|
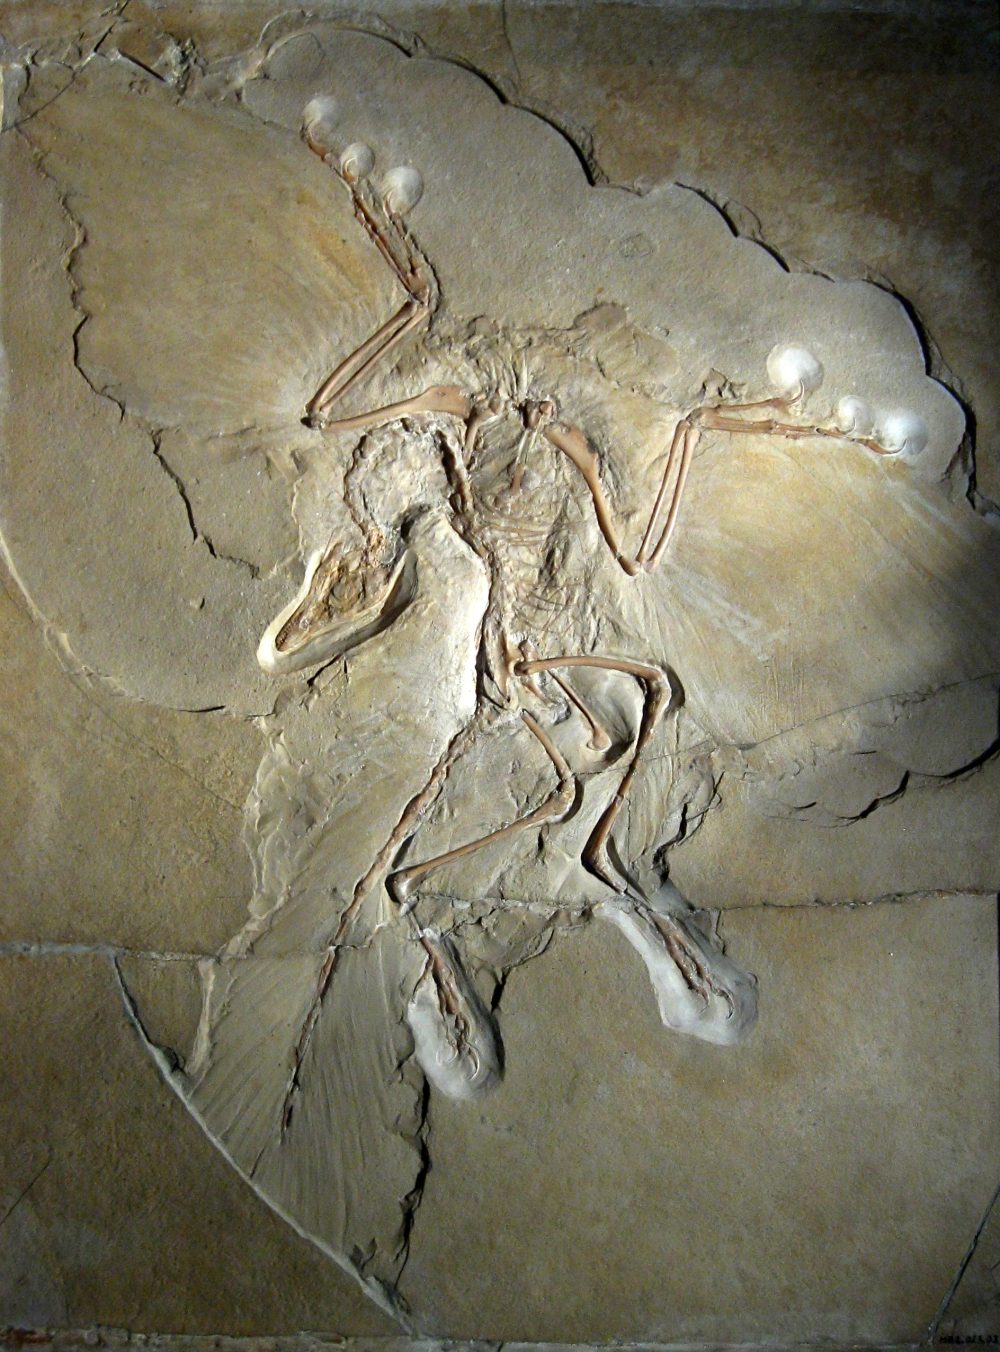
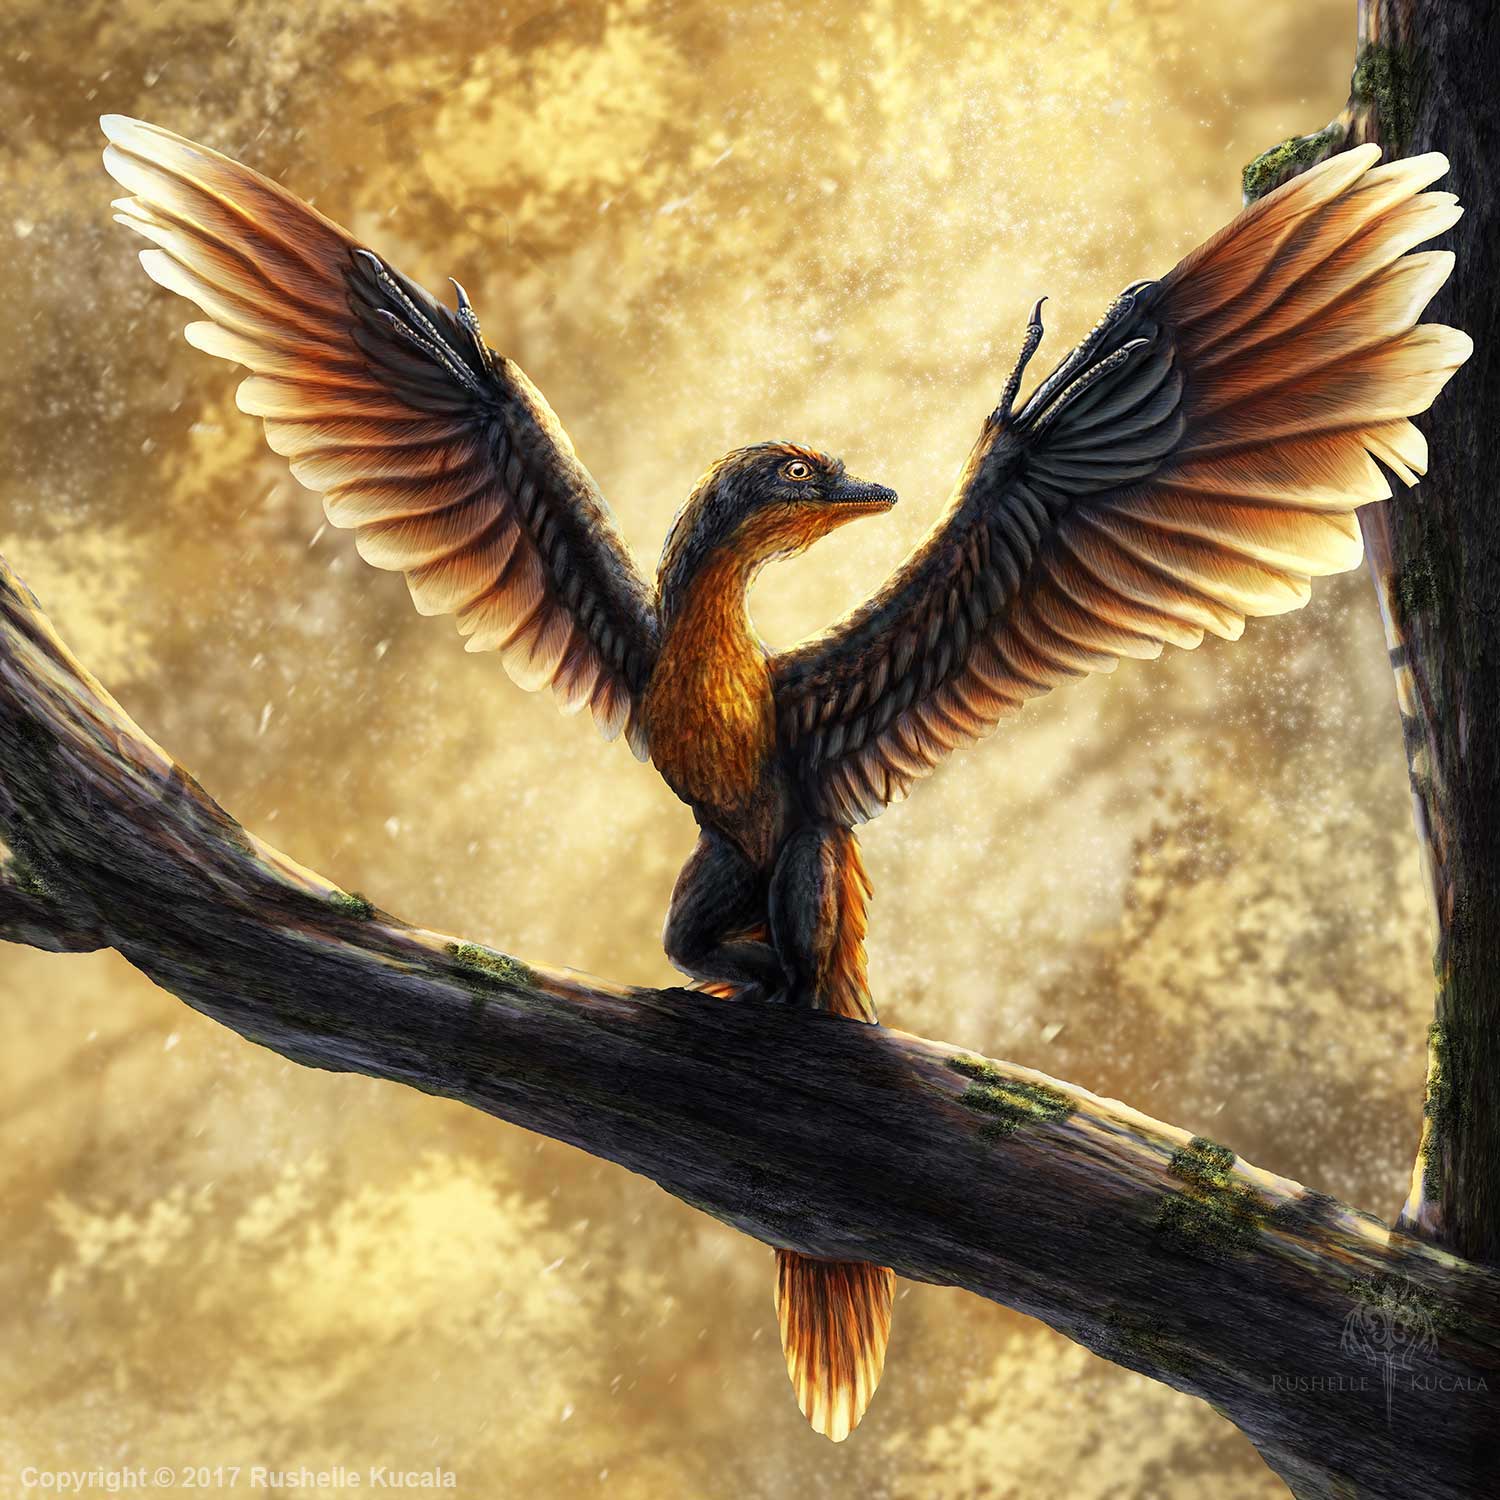
The answer is “both.” Birds are dinosaurs. If you’re interested in how that claim is supported by evidence, you can read about it in this article on BirdLife International’s website (the link opens in a new tab).
For living species, since about the 1940s, phylogenetic analysis has been based on molecular evidence. This evidence has focused on proteins and nucleic acids (DNA and RNA).
7b. Evidence from Proteins
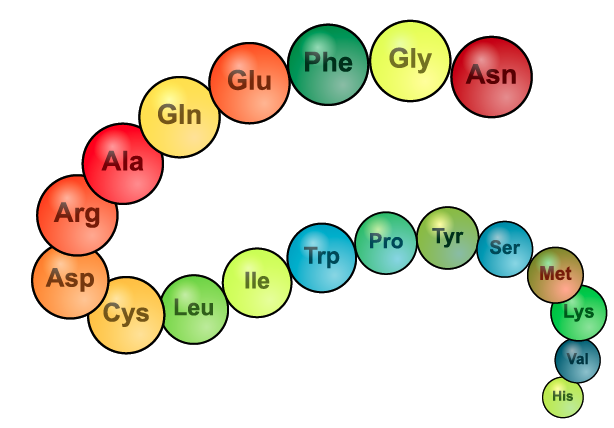
In terms of phylogeny, the key thing to remember about proteins is that they’re composed of building blocks called amino acids. In the diagram at left, these amino acids are represented by three-letter abbreviations such as Asn, Gly, Phe, etc. During the process of protein synthesis, these amino acids are chained together in a genetically determined sequence.
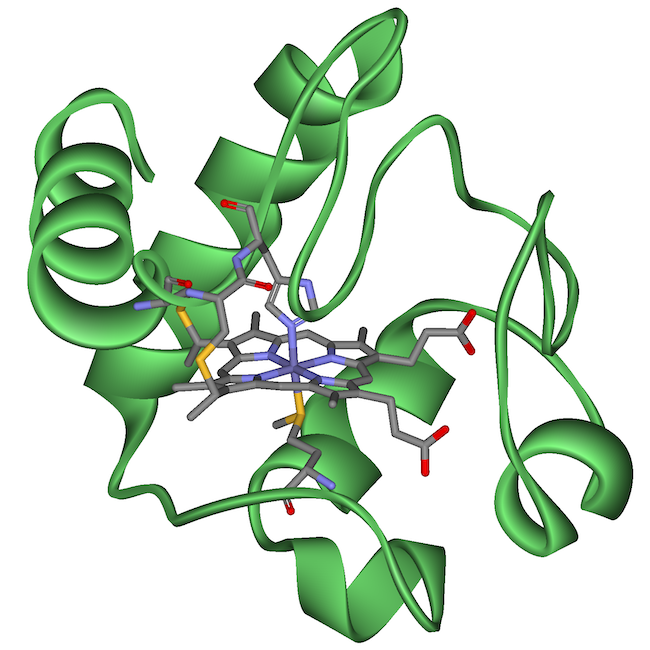
A protein called cytochrome c has been widely used to determine evolutionary relationships. Why? Because cytochrome c is a key enzyme used by mitochondria during cellular respiration. As a result, every organism with mitochondria — that means millions of eukaryotic species — has this molecule. The fact that these species share mitochondria and cytochrome c is itself a shared derived feature, and it’s evidence that all eukaryotes make up a clade.
Cytochrome c is composed of 100 amino acids. In the table below, amino acids 60 through 66 within cytochrome c are compared for 9 species. In the table, the letters represent different amino acids (“K” represents lysine, “G” represents glycine, and so on).
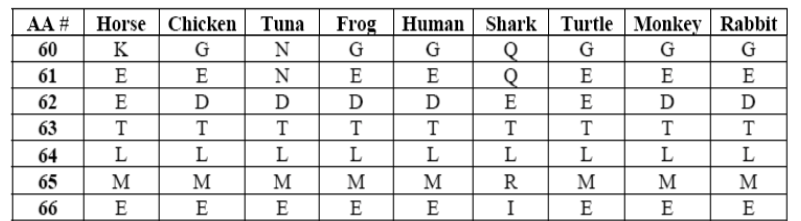
Look at amino acid position 64. Every species on the table has the same amino acid at that position. It’s “L,” which represents leucine. At position 65, every organism except for the shark has the amino acid “M.”
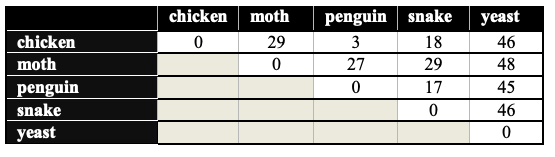
By doing this type of analysis, you can count the amino acid differences within the cytochrome c protein among the members of any species. The result of one such analysis is shown below. Here’s how to read it. Find where the chicken and the moth intersect. The number 29 means that between chickens and moths, there are 29 amino acid differences in the cytochrome c sequence. Between chickens and penguins, there are three differences.
Complete the interactive reading below to see how the information in this table can be used to construct a phylogenetic tree.
[qwiz style=”width: 600px !important; min-height: 450px !important;” qrecord_id=”sciencemusicvideosMeister1961-Cytochrome c and phylogeny: interactive reading (v2.0)”]
[h] Cytochrome c and phylogeny: interactive reading
[q] Study the table below. It shows the number of amino acid differences in cytochrome c in 5 different species. Just a glance tells you that the chicken’s cytochrome c is most similar to that of the [hangman], and most different from that of [hangman].
[c]IHBlbmd1aW4=[Qq]
[f]IEV4Y2VsbGVudCE=[Qq]
[c]IHllYXN0[Qq]
[f]IEdyZWF0IQ==[Qq]
[q labels = “top”]Based on the cytochrome c differences in the table below, drag the organisms listed above into the correct position. Note the position of the chicken. Use trial and error if you need to.
[l]moth
[f*] Good!
[fx] No, that’s not correct. Please try again.
[l]penguin
[f*] Good!
[fx] No. Please try again.
[l]snake
[f*] Nice!
[fx] No, that’s not correct. Please try again.
[l]yeast
[f*] Good!
[fx] No. Please try again.
[q labels = “top”]Classifying based on cytochrome c amino acid sequences confirms what we’d expect from classification based on anatomy and body structure. It makes sense that penguins and chickens would share the closest amino acid ____________. That’s because they’re both __________. It also makes sense that the chicken’s next closest relationship would be the ___________. That’s because both chickens and snakes (and penguins) are in the ____________ clade.
[l]vertebrate
[f*] Good!
[fx] No. Please try again.
[l]birds
[f*] Excellent!
[fx] No, that’s not correct. Please try again.
[l]sequence
[f*] Great!
[fx] No, that’s not correct. Please try again.
[l]snake
[f*] Excellent!
[fx] No, that’s not correct. Please try again.
[q multiple_choice=”true”] In the phylogenetic tree below, what’s the best justification for the claim that yeast are the most distant relative of the chicken?
[c]IEJlY2F1c2UgdGhleSYjODIxNztyZSBmdXJ0aGVzdCB0byB0aGUgbGVmdCwgYWZ0ZXIgdGhlIHBlbmd1aW4sIHNuYWtlLCBhbmQgbW90aC4=[Qq]
[f]IE5vLiBSZW1lbWJlciB0aGF0IGFueSBwaHlsb2dlbmV0aWMgdHJlZSBjYW4gdHdpc3QgaW4gc3BhY2UuIEl0JiM4MjE3O3Mgbm90IGFib3V0IHRoZSBob3Jpem9udGFsIGFycmFuZ2VtZW50LiBJdCYjODIxNztzIGFib3V0IHRoZSBtb3N0IHJlY2VudCBjb21tb24gYW5jZXN0b3Iu[Qq]
[c]IEJlY2F1c2UgeWVhc3QgYW5kIGNoaWNrZW5zIHNoYXJlIH RoZSBtb3N0IGRpc3RhbnQgY29tbW9uIGFuY2VzdG9yLg==[Qq]
[f]IE5pY2UhIFlvdSBhbmFseXplIGNsb3NlbmVzcyBvbiBhIHBoeWxvZ2VuZXRpYyB0cmVlIGJhc2VkIG9uIHRoZSBtb3N0IHJlY2VudCBjb21tb24gYW5jZXN0b3Iu[Qq]
[x]
What’s the takeaway?
- Shared proteins are shared derived features.
- Sequence similarities are also shared derived features, and can be used as the basis for classifying species.
[/qwiz]
7c. Evidence from DNA
The gold standard for analyzing phylogeny is DNA. To trace phylogeny, biologists find common DNA sequences and then identify mutations that have arisen in related lineages. Mutations within shared DNA sequences can be seen as shared derived features.
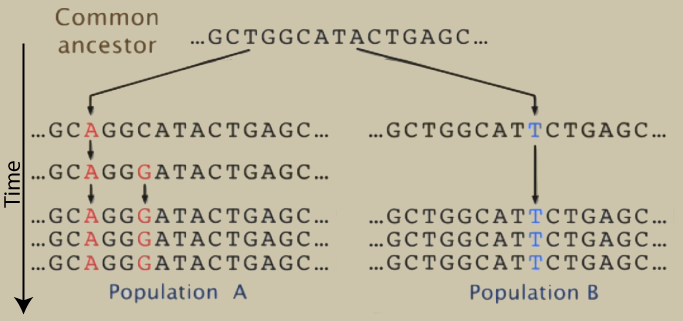
in the example above, the common ancestor, population A, and population B all form a clade with two branches.
The basic ideas behind phylogenetic analysis based on DNA are the same as we saw above for proteins.
- In a given stretch of DNA, the more nucleotides that two species share, the more closely they’re related.
- Similarities in DNA can be used as shared derived features for organizing species into clades.
The image below shows how DNA sequences were used to create a phylogenetic tree for 8 species.
Here’s some of the thinking involved in constructing the phylogenetic tree from this DNA evidence.
- The paired species (C and D, E and F, G and H, and A and B) were paired together because their sequences are the same. In other words, the shared sequence is a shared derived feature that puts each pair within the same clade.
- Species E, F, G, and H are organized into a clade because they share the nucleotide “T” at position 3. Again, the shared nucleotide is a shared derived feature.
- Species A and B share 3 nucleotide differences (at positions 2, 4, and 7). This makes their clade appear to be more distantly related to the clade that includes species C, D, E, F, G, and H.
The DNA of any species consists of millions or billions of nucleotides, so phylogenetic analysis of DNA usually involves huge amounts of data. The size of the data set is what makes DNA such valuable evidence for determining phylogeny. At the same time, that much data requires that most DNA-based phylogeny is done by computers. This type of evolutionary analysis is one of the topics studied in the emerging field of bioinformatics, which we briefly discussed in AP Bio Topic 6.8.
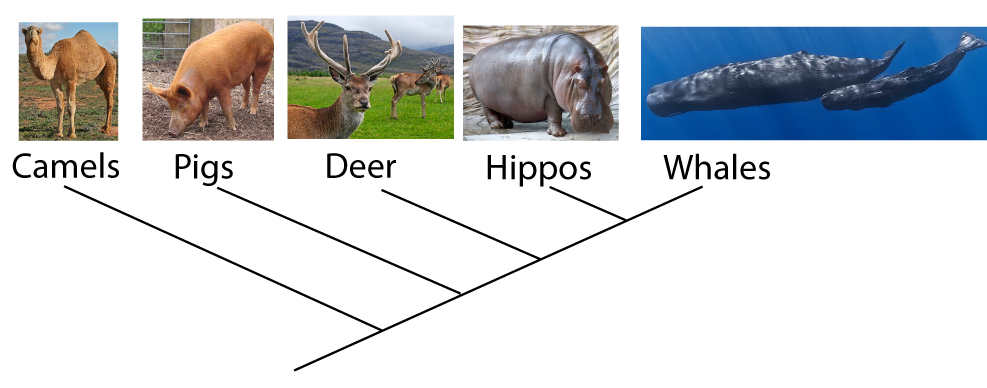
Using such analysis is enabling scientists to redraw the tree of life. For example, a 1999 analysis of DNA established that the land-living mammal that’s the closest relative of whales is the hippopotamus, as shown by the phylogenetic tree below.
7d. Phylogenies Using DNA Evidence
[qwiz style=”width: 600px !important; min-height: 450px !important;” qrecord_id=”sciencemusicvideosMeister1961-Phylogenies Using DNA Evidence (v2.0)”]
[h] Phylogenies Using DNA Evidence
[q] DNA data is usually analyzed by computers that use algorithms to determine the most likely phylogenetic relationships. But by looking at just a few homologous nucleotide sequences, you can get a sense of how this type of analysis works.
The table below shows a stretch of 16 homologous nucleotides within the DNA of Hawaiian honeycreepers.
These birds, along with the Galapagos Finches, are a widely studied example of adaptive radiation. A dash (“-“) indicates that the nucleotide is identical. Based on the sequence, see what you can figure out about honeycreeper evolution.
[q] Here’s a hint to help you get started. Find the nucleotide position that has an identical nucleotide in all the five birds shown. That’s a trait that’s shared by all of the birds, and it’ll go at the root of the tree you’ll build in the next card. The answer is a number.
[textentry single_char=”true”]
[c]ID I=[Qq]
[f]IFllcy4gVGhlIG51Y2xlb3RpZGUgJiM4MjIwO1QmIzgyMjE7IGlzIGluIHBvc2l0aW9uIDIgaW4gYWxsIGZpdmUgc3BlY2llcy4=[Qq]
[c]ICo=[Qq]
[f]IE5vLiBIZXJlJiM4MjE3O3MgYSBoaW50LiBJdCBpbnZvbHZlcyB0aGUgbnVjbGVvdGlkZSAmIzgyMjA7dGh5bWluZS4mIzgyMjE7[Qq]
[c]IEVudGVyIGxldHRlcg==[Qq]
[f]IFNvcnJ5LCBuby4=[Qq]
[q labels = “top”]
[l]Common Rosefinch
[f*] Great!
[fx] No, that’s not correct. Please try again.
[l]Kaua’i ‘amakihi
[f*] Correct!
[fx] No. Please try again.
[l] ‘L’iwi
[f*] Excellent!
[fx] No, that’s not correct. Please try again.
[l]Po’ouli
[f*] Good!
[fx] No, that’s not correct. Please try again.
[l]A, position 1
[f*] Good!
[fx] No, that’s not correct. Please try again.
[l]A, position 16
[f*] Correct!
[fx] No. Please try again.
[l]C, position 4
[f*] Great!
[fx] No, that’s not correct. Please try again.
[l]T, position 2
[f*] Correct!
[fx] No, that’s not correct. Please try again.
[q] A similar type of analysis can be used to determine the source of HIV, the virus that causes AIDS. At some point during the 20th century, the virus jumped from animal populations to human populations. This viral crossover came about from blood-blood contact as humans butchered animals such as chimps and gorillas. Study the table below. It compares 3 strains of HIV to four strains of SIV (simian immunodeficiency virus). SIV infects chimps and gorillas, where it can cause symptoms similar to AIDS in humans.
Because HIV and SIV are retroviruses, their genetic material is made of RNA, where the base uracil (U) substitutes for thymine in DNA. The source of the data is PBS’s NOVA Evolution Lab. The RNA shown is a stretch from a 645 base nucleotide sequence.
[q]Use the RNA nucleotide sequence data below to determine the evolutionary history of various strains of HIV. Note that on one of the branches, you’ll be able to reduce the possibilities to 50/50, and then you’ll have to guess. Good luck!
[l] SIV-TAN1
[f*] Good!
[fx] No. Please try again.
[l] SIV-MB897
[f*] Great!
[fx] No. Please try again.
[l] SIV-EK505
[f*] Correct!
[fx] No. Please try again.
[l] Gorilla SIV
[f*] Correct!
[fx] No, that’s not correct. Please try again.
[l] HIV-1 P
[f*] Correct!
[fx] No. Please try again.
[l] A position 1
[f*] Excellent!
[fx] No, that’s not correct. Please try again.
[l] A position 11
[f*] Great!
[fx] No, that’s not correct. Please try again.
[l] C position 1
[f*] Correct!
[fx] No. Please try again.
[l] G position 14
[f*] Great!
[fx] No. Please try again.
[l] U position 7
[f*] Correct!
[fx] No, that’s not correct. Please try again.
[q labels=”right”]Based on the phylogeny below, you can conclude that a group that consisted of the three HIV strains shown below could not be a _________. Rather, each strain emerged ____________ from strains of SIV in different groups of apes.
[l]clade
[f*] Good!
[fx] No. Please try again.
[l]independently
[f*] Correct!
[fx] No. Please try again.
[x]
[restart]
[/qwiz]
8. Is it a Cladogram or a Phylogenetic Tree?
Note that a distinction can be made between a cladogram and a phylogenetic tree.
Strictly speaking, a cladogram shows the branching pattern of evolution only, with no reference to time. A phylogenetic tree, by contrast, is usually scaled, with branch lengths being proportional to the amount of time between the events indicated on the tree.
Many sources, however, use the terms interchangeably.
9. Evidence for Tracing Phylogeny: Flashcards
[qdeck bold_text=”false” style=”width: 600px !important; min-height: 450px !important;” qrecord_id=”sciencemusicvideosMeister1961-Evidence for Tracing Phylogeny: Flashcards (v2.0)”]
[h]Evidence for Tracing Phylogeny: Flashcards
[q]A clade called the ruminantia includes animals such as cows, deer, and antelopes. Their shared derived features include a certain type of hoof and a four-chambered stomach. How would you describe this type of shared derived feature?
[a]These are shared derived features based on anatomy (or body structure). Morphology would also have been a fine answer.
[q]Phylogenetic analysis based on proteins uses sequences of ___________ as shared derived features.
[a]Phylogenetic analysis based on proteins uses sequences of amino acids as shared derived features.
[q]Phylogenetic analysis based on DNA or RNA uses sequences of _______________ as shared derived features.
[a]Phylogenetic analysis based on DNA or RNA uses sequences of nucleotides as shared derived features.
[q]The image below shows phylogenetic analysis based on ___________
[a]The image below shows phylogenetic analysis based on DNA or nucleotide sequences.
[q]COMPLETE THIS SENTENCE: In a given stretch of DNA or within a protein, the more nucleotides or amino acids that two species share…
[a]In a given stretch of DNA or within a protein, the more nucleotides or amino acids that two species share, the more closely they’re related.
[q]In the DNA sequences shown below, the shared “T” in species E, F, G, and H can be used as a ____________ for classification.
[a]In the DNA sequences shown below, the shared “T” in species E, F, G, and H can be used as a shared derived feature for classification.
[q]Because the diagram below has no timescale, it should be referred to as a _____________ (rather than a phylogenetic tree).
[a]Because the diagram below has no timescale, it should be referred to as a cladogram.
[q]Because the length of the lineages in the diagram below is proportional to time, it’s properly referred to as a __________________ (and not just a cladogram)
[a]Because the lineages are proportional to time, the diagram qualifies as a phylogenetic tree.
[q]The diagram of plant evolution below lacks any explicit reference to time, but it does show clades and branching evolution. That means that strictly speaking, it should be called a _________________. But it’s probably fine if you called it a _______________.
[a]Strictly speaking, the diagram below should be called a cladogram (because there’s no reference to time). But it’s probably fine if you called it a phylogenetic tree.
[/qdeck]
10. What’s Next?
Proceed to Topic 7.9, Part 3: Clades, Taxonomy, and Molecular Clocks, the next tutorial in this AP Bio Unit 7 (Evolution)