1. Introduction: Linked genes are on the same chromosome
In the last tutorial, we looked at dihybrid crosses and independent assortment. We saw how you can use the FOIL algorithm (First, Outside, Inside, Last) to determine how a dihybrid parent with a genotype like BbEe can produce, through independent assortment, four possible combinations of alleles in its gametes: BE, Be, bE, and be. Because there are four gametes, predicting the outcome of a dihybrid cross (BbEe x BbEe) requires a 4 x 4 Punnett square, and results in a 9:3:3:1 ratio of phenotypes in the offspring.
Independent assortment only happens if the genes for these alleles are on separate homologous pairs, as shown below.
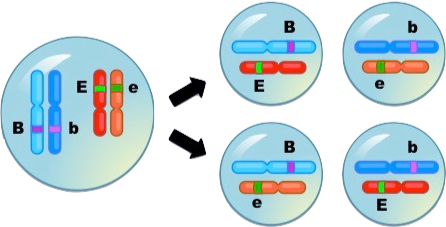
Animals — just to mention a group of organisms of particular interest — typically have thousands of protein-coding genes. Humans have about 20,000. In mice, there are about 30,000, and in the nematode worm (widely used in studies of development) there are 18,000. These genes are distributed over a much smaller number of chromosomes: humans have 23 pairs; mice have 20 pairs, and nematode worms have six pairs in their hermaphroditic form, and 5 pairs plus one additional chromosome in their male form). As a result, many genes are linked, which means “on the same chromosome.” The image below, for example, shows five linked genes on one of the chromosomes of the fruit fly, Drosophila melanogaster.
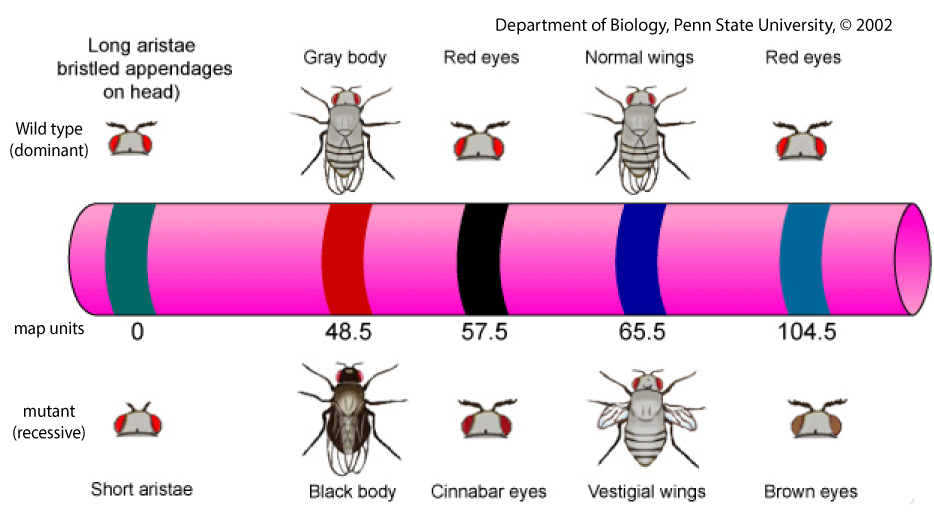
Wild-type traits (the ones depicted above the chromosome in Figure 2) are the ones one would find in flies in the wild. In the case of fruit flies, “in the wild” means flying around a fruit bowl in one’s kitchen. For our purposes (which means “what’s needed in an introductory college biology course”), you can think of “wild type” and “dominant” as synonymous. Mutant traits (shown below the chromosome in figure 2) are recessive and were generally discovered in a laboratory (or induced in a laboratory by exposing organisms to various mutation-inducing agents, such as X-rays).
2. Non-Linked vs. Linked Genes
Linked genes are inherited differently from non-linked genes.
[qwiz summary = “false” qrecord_id=”sciencemusicvideosMeister1961-Linkage: The Big Idea”]
[h]Linkage: the big idea
[q]Here’s a very simplified diagram showing what linkage and non-linkage look like. Cells 1 and 2 are both germ cells: diploid cells that haven’t yet undergone the gamete-producing process of meiosis. The key difference between these cells is that the “T” and “A” genes in cell 1 are not [hangman]. During meiosis, they’ll undergo [hangman] assortment to produce [hangman] distinct types of gametes.
[c]bGlua2Vk[Qq]
[c]aW5kZXBlbmRlbnQ=[Qq]
[c]Zm91cg==[Qq]
[q]But because genes “T” and “A” in cell 2 are [hangman], there won’t be independent assortment. We’d expect that only [hangman] types of gametes will be produced.
[c]bGlua2Vk[Qq]
[c]dHdv[Qq]
[q labels = “top”]This diagram compares linkage and non-linkage. Drag the labels to complete the diagram.
[l]yes
[fx] No. Please try again.
[f*] Excellent!
[l]no
[fx] No. Please try again.
[f*] Correct!
[l]gametes
[fx] No, that’s not correct. Please try again.
[f*] Great!
[l]germ cells
[fx] No, that’s not correct. Please try again.
[f*] Excellent!
[x]Continue reading below.
[/qwiz]
3. Genetic Crosses Involving Linkage
While linked genes don’t independently assort, they can separate from one another. This separation happens because of crossing over during Prophase 1 of meiosis. To understand this, we need to see what happens in crosses that involve linked genes.
The initial work on this was done in the early 1900s at Columbia University in New York, in a laboratory led by Thomas Hunt Morgan. Morgan used the fruit fly, Drosophila melanogaster, as his experimental model.
Like Mendel, Morgan started by finding true-breeding varieties. Then he would hybridize these true-breeding varieties to create F1 hybrids.
Morgan started his hybridization experiments with a true-breeding male fly who was homozygous for two mutant, recessive traits: black body and vestigial wings. A black body is exactly what it sounds like. Vestigial wings are shrunken, as shown below.
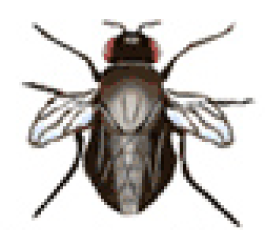
To represent the alleles in their flies, Morgan’s team devised a system that’s different from the one we’ve used to represent alleles in Mendelian crosses. In Morgan’s system, the genotype of a black-bodied, vestigial winged fly is symbolized as b b vg vg. Each “b” represents a black body allele, and each “vg” represents a vestigial winged allele. Note that these traits are not sex-linked.
Morgan crossed this fly with a true-breeding female that had the normal, wild-type body color (gray) and a normal, wild-type wing structure.
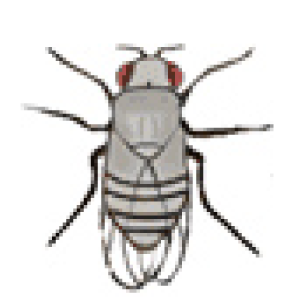
To represent these wild-type, dominant alleles, Morgan’s team used the mutant symbols but added a superscript plus sign (+) after each symbol.
Thus, the wild type female’s genotype is b+b+ vg+ vg+.
So, here’s our P (parental) generation cross:
[qwiz summary = “false”]
[h]Morgan’s P generation Cross
[q]In your student learning guide, predict the phenotype and genotype of the F1 hybrids:
[c]U2hvdyB0aG UgYW5zd2Vy[Qq]
[f]
Cg==Cg==[Qq]Keep reading below.
[/qwiz]
Next, Morgan did a testcross. A testcross is a cross with an organism that has the recessive phenotype. It’s called a testcross because it allows a geneticist (or any breeder) to determine whether an organism with a dominant phenotype but unknown genotype is homozygous dominant or heterozygous. For example, say you had a fly with a gray body, but you didn’t know if it was a homozygote (b+b+) or a heterozygote (b+b). Cross that fly with a black-bodied fly (genotype b b). If any of the offspring are black-bodied, you’d know that your gray-bodied parent was a heterozygote. Here’s the Punnett square, with the tester (the recessive organism) on the top row.
| b | b | |
| b+ | b+b | b+b |
| b | b b | b b |
50% of the offspring have genotype b b, and you’ll see the black-bodied phenotype in 50% of the offspring.
If, after producing many offspring, none of the offspring are gray-bodied, you can be certain that your gray-bodied parent was homozygous. Here’s the Punnett square.
| b | b | |
| b+ | b+b | b+b |
| b+ | b+b | b+b |
100% of the offspring have genotype b+b, and none of the offspring will have the black-bodied phenotype.
Why did Morgan do a testcross when he knew the genotype of his F1 flies? As we’ll see, it made analysis of his results much easier, because it reduced the number of expected phenotypes in the offspring.
Here’s Morgan’s test cross:
- b+b vg+ vg x b b vg vg
Let’s predict the results. We’re going to do this by solving two Punnett squares, each based on different assumptions. The first is based on the assumption that the alleles are not linked, and that they’ll independently assort (even though we know that this is not correct: the tutorial, after all, is about linkage). Then we’ll assume that the alleles are linked.
[qwiz style = “width:675px” summary = “false” qrecord_id=”sciencemusicvideosMeister1961-Morgan’s F1 Cross”]
[h]Morgan’s F1 cross.
[q labels = “top”]Punnett Square # 1: NO LINKAGE: the testcross is b+b vg+ vg x b b vg vg. Place the alleles using FOIL.
| _______F________ | _______O_______ | _______I_______ | _______L_______ | |
| ___ ___ | ___ ___ | ___ ___ | ___ ___ | |
| ___ ___ | ___ ___ ___ ___ | ___ ___ ___ ___ | ___ ___ ___ ___ | ___ ___ ___ ___ |
| Phenotype: | ______________ ______________ |
______________ ______________ |
______________ ______________ |
______________ ______________ |
| % of offspring w/ phenotype | _________ | _________ | _________ | _________ |
[l]b vg
[fx] No, that’s not correct. Please try again.
[f*] Excellent!
[l]b+vg+
[fx] No, that’s not correct. Please try again.
[f*] Excellent!
[l]b vg+
[fx] No. Please try again.
[f*] Excellent!
[l]b+ vg
[fx] No. Please try again.
[f*] Correct!
[l]b b vg vg
[fx] No. Please try again.
[f*] Great!
[l]b+b vg+ vg
[fx] No. Please try again.
[f*] Excellent!
[l]b b vg+ vg
[fx] No, that’s not correct. Please try again.
[f*] Good!
[l]b+b vg vg
[fx] No, that’s not correct. Please try again.
[f*] Excellent!
[l]black body, normal wings
[fx] No, that’s not correct. Please try again.
[f*] Good!
[l]gray body normal wings
[fx] No, that’s not correct. Please try again.
[f*] Great!
[l]gray body, vestigial wings
[fx] No, that’s not correct. Please try again.
[f*] Correct!
[l]black body, vestigial wings
[fx] No. Please try again.
[f*] Great!
[l]25%
[fx] No. Please try again.
[f*] Great!
[l]50%
[fx] No, that’s not correct. Please try again.
[f*] Great!
[q]Let’s summarize what we just did. If the alleles are not linked, then we’d expect [hangman] phenotypes: normal body, normal wings; normal body, vestigial wings; black body, normal wings, and black body, vestigial wings. Each phenotype would be [hangman] represented, with 25% of the offspring in each phenotype class.
What if the alleles were linked?
[c]Zm91cg==[Qq]
[c]ZXF1YWxseQ==[Qq]
[q labels = “top”]Punnett Square 2. This one assumes linkage. I’ve added a diagram showing the male and female germ cells and gametes. Fill in the blanks on that diagram, too.
[l]b+ b vg+ vg
[fx] No, that’s not correct. Please try again.
[f*] Good!
[l]b b vg vg
[fx] No, that’s not correct. Please try again.
[f*] Good!
[l]b+
[fx] No. Please try again.
[f*] Excellent!
[l]b vg
[fx] No. Please try again.
[f*] Good!
[l]vg+
[fx] No, that’s not correct. Please try again.
[f*] Good!
[l]b b vg+ vg
[fx] No, that’s not correct. Please try again.
[f*] Excellent!
[l]normal body, normal wing
[fx] No, that’s not correct. Please try again.
[f*] Excellent!
[l]black body, vestigial wing
[fx] No. Please try again.
[f*] Excellent!
[l]25%
[fx] No. Please try again.
[f*] Good!
[l]50%
[fx] No. Please try again.
[f*] Good!
[l]75%
[fx] No, that’s not correct. Please try again.
[f*] Great!
[q]Let’s summarize the linkage model. The cross is b+b vg+ vg x b b vg vg. If the body color and wing type genes are linked, then we’d expect [hangman] phenotypes in the offspring, with each class equally represented.
[c]dHdv[Qq]
[x]SUMMARY:
- With independent assortment, there’ll be four phenotype classes, with each class equally represented (25% in each class)
- If the alleles are linked, there’ll be two phenotype classes. Both classes are equally represented (50% in each class).
Read on to see what actually happens.
[/qwiz]
4. When linked genes recombine, it’s because of crossing over
Here are the actual results of Morgan’s F1 test cross between b+b vg+ vg x b b vg vg. The total number of offspring produced was 2300. If you need to, grab a calculator to complete the table below, which compares actual results to expected results from independent assortment and linkage.
[qwiz qrecord_id=”sciencemusicvideosMeister1961-Morgan’s F2 Results”]
[h]Morgan’s F2 results
[q labels = “top”]
[l]0
[fx] No, that’s not correct. Please try again.
[f*] Excellent!
[l]575
[fx] No. Please try again.
[f*] Great!
[l]1150
[fx] No. Please try again.
[f*] Great!
[q]Two new terms will be useful to understand what happened:
- The offspring that have the same phenotype as the parent are said to have a parental phenotype.
- The offspring with one trait from one parent and the second trait from the other parent are said to have a recombinant phenotype. In the case of these flies, it would be one parent’s body type and the other parent’s wing type.
[q]In the diagram below, gray body-vestigial wings and black body-normal wings are [hangman] phenotypes, while gray body-normal wings and black body-vestigial wings are [hangman] phenotypes. We can apply these same terms to the genotypes: b+b vg+ vg is an example of a [hangman] genotype, while bb vg+ vg is an example of a [hangman] genotype.
[c]cmVjb21iaW5hbnQ=[Qq]
[c]cGFyZW50YWw=[Qq]
[c]cGFyZW50YWw=[Qq]
[c]cmVjb21iaW5hbnQ=[Qq]
[q]If you look at the results from Morgan’s cross, a reasonable interpretation is that the results are somewhat closer to the [hangman] hypothesis. But we still have to explain the [hangman] offspring.
[c]bGlua2FnZQ==[Qq]
[c]cmVjb21iaW5hbnQ=[Qq]
[/qwiz]
Why are there mostly parental phenotypes, but significant numbers of recombinants? The answer involves crossing over between homologous chromosomes during prophase 1 of meiosis.
Read the explanation that follows. Note that you can scroll the text below the diagram.
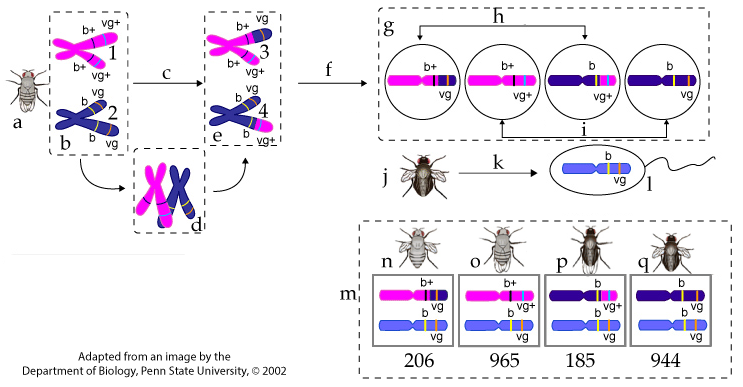
Letter “a” shows the F1, dihybrid female. Letter “b” shows the chromosomes in her germ cells (the cells that undergo meiosis to make egg cells). Chromosome # 1 was inherited from her mother, a wild-type, purebred, gray-bodied, normal-winged fly whose genotype was b+b+ vg+ vg+. Chromosome # 2 was inherited from her father, a double mutant purebred black-bodied, vestigial-winged fly whose genotype was b b vg vg.
Letter “c” represents meiosis I. During prophase 1 of meiosis I, the homologous pairs paired up (shown at “d”), and crossing over led to recombination (shown at “e”). In chromosome # 3, the upper chromatid has a recombinant genotype of b+ vg. In chromosome # 4, the lower chromatid has the recombinant genotype b vg+.
Letter “f” represents meiosis II, during which sister chromatids are pulled apart. The result is four haploid eggs (represented at “g”). Two of these eggs (“h”) have recombinant genotypes (b+ vg and b vg+). The other two eggs (at “i”) have parental genotypes (b+ vg+ and b vg). (Note that Drosophila has four homologous pairs of chromosomes: we’re only focusing on the one with the alleles that we’re following).
Letter “j” shows the double mutant father used in this testcross. Because his genotype was b b vg vg, the only allele combination that’s possible for the haploid sperm that he creates through meiosis (“k”) are b vg, as shown in the sperm cell at letter “l.”
Letter “m” shows the offspring. Of the 2300 offspring produced, 391 had recombinant phenotypes (phenotypes “n” and “p”). The rest of the offspring (at “o” and “q”) have parental phenotypes.
You can the use frequency of recombinants to calculate a recombination frequency. Divide 391 by 2300, which gives you 0.17, or 17%. That’s how often the body color and wing-type alleles crossed over with one another during meiosis.
5. Linkage and Recombination: Checking Understanding
Let’s see how well you’ve understood what’s been covered above.
[qwiz style=”width: 600px !important;” random = “true” qrecord_id=”sciencemusicvideosMeister1961-Linkage, Meiosis, and Recombination: CFU”] [h]
Linkage and recombination
[i]
[q] In the diagram below, which letter indicates meiosis I?
[textentry single_char=”true”]
[c]IG M=
[f]IEV4Y2VsbGVudC4gTGV0dGVyICYjODIyMDtjJiM4MjIxOyBpbmRpY2F0ZXMgbWVpb3NpcyAxLg==[Qq]
[c]IEVudGVyIHdvcmQ=[Qq]
[f]IE5vLCB0aGF0JiM4MjE3O3Mgbm90IGNvcnJlY3Qu[Qq]
[c]ICo=[Qq]
[f]IE5vLiBIZXJlJiM4MjE3O3MgYSBoaW50LiBEdXJpbmcgbWVpb3NpcyAxLCBob21vbG9nb3VzIGNocm9tb3NvbWVzIHN5bmFwc2Ugd2l0aCBvbmUgYW5vdGhlciBhbmQgY3Jvc3Npbmcgb3ZlciBvY2N1cnMu[Qq]
[q] In the diagram below, which letter indicates meiosis II?
[textentry single_char=”true”]
[c]IG Y=
[f]IEV4Y2VsbGVudC4gTGV0dGVyICYjODIyMDtmJiM4MjIxOyBpbmRpY2F0ZXMgbWVpb3NpcyBJSS4=[Qq]
[c]IEVudGVyIHdvcmQ=[Qq]
[f]IE5vLCB0aGF0JiM4MjE3O3Mgbm90IGNvcnJlY3Qu[Qq]
[c]ICo=[Qq]
[f]IE5vLiBIZXJlJiM4MjE3O3MgYSBoaW50LiBEdXJpbmcgbWVpb3NpcyBJSSwgc2lzdGVyIGNocm9tYXRpZHMgYXJlIHB1bGxlZCBhcGFydCwgZm9ybWluZyBoYXBsb2lkIGdhbWV0ZXMu[Qq]
[q] In the diagram below, which letter indicates female gametes with recombinant chromosomes?
[textentry single_char=”true”]
[c]IG g=
[f]IEZhbnRhc3RpYyEgTGV0dGVyICYjODIyMDtoJiM4MjIxOyBpbmRpY2F0ZXMgZmVtYWxlIGdhbWV0ZXMgd2l0aCByZWNvbWJpbmFudCBjaHJvbW9zb21lcy4=[Qq]
[c]IEVudGVyIHdvcmQ=[Qq]
[f]IE5vLCB0aGF0JiM4MjE3O3Mgbm90IGNvcnJlY3Qu[Qq]
[c]ICo=[Qq]
[f]IE5vLiBIZXJlJiM4MjE3O3MgYSBoaW50LiBMb29rIGZvciBjaHJvbW9zb21lcyB0aGF0IHJlY29tYmluZSB0aGUgYWxsZWxlcyBpbiB0aGUgb3JpZ2luYWwgcGFyZW50YWwgY2hyb21vc29tZXMsIHdoaWNoIGFyZSBzaG93biBpbiAmIzgyMjA7Yi4mIzgyMjE7IEluIG90aGVyIHdvcmRzLCBsb29rIGZvciByZWNvbWJpbmF0aW9ucyBiZXR3ZWVuIGI=Kw==IHZnICs=IGFuZCBiIHZnLg==[Qq]
[q] In the diagram below, which letter indicates female gametes with parental chromosomes?
[textentry single_char=”true”]
[c]IG k=[Qq]
[f]IE5pY2Ugam9iISBMZXR0ZXIgJiM4MjIwO2kmIzgyMjE7IGluZGljYXRlcyBmZW1hbGUgZ2FtZXRlcyB3aXRoIHBhcmVudGFsIGNocm9tb3NvbWVzLg==[Qq]
[c]IEVudGVyIHdvcmQ=[Qq]
[f]IE5vLCB0aGF0JiM4MjE3O3Mgbm90IGNvcnJlY3Qu[Qq]
[c]ICo=[Qq]
[f]IE5vLiBIZXJlJiM4MjE3O3MgYSBoaW50LiBMb29rIGZvciBnYW1ldGVzIHRoYXQgaGF2ZSB0aGUgc2FtZSBjb21iaW5hdGlvbiBvZiBhbGxlbGVzIGFzIGZvdW5kIGluICYjODIyMDtiLCYjODIyMTsgd2hpY2ggc2hvd3MgdGhlIG9yaWdpbmFsIHBhcmVudGFsIGNocm9tb3NvbWVzIChiZWZvcmUgYW55IGNyb3NzaW5nIG92ZXIgcmVzdWx0aW5nIGZyb20gbWVpb3Npcyku[Qq]
[q] In the diagram below, which letter indicates crossing over?
[textentry single_char=”true”]
[c]IG Q=[Qq]
[f]IEdvb2Qgd29yayEgTGV0dGVyICYjODIyMDtkJiM4MjIxOyBzaG93cyBob21vbG9nb3VzIGNocm9tb3NvbWVzIGluIHRoZSBwcm9jZXNzIG9mIGNyb3NzaW5nIG92ZXIu[Qq]
[c]IEVudGVyIHdvcmQ=[Qq]
[f]IE5vLCB0aGF0JiM4MjE3O3Mgbm90IGNvcnJlY3Qu[Qq]
[c]ICo=[Qq]
[f]IE5vLiBIZXJlJiM4MjE3O3MgYSBoaW50LiBMb29rIGZvciBnYW1ldGVzIHRoYXQgaGF2ZSB0aGUgc2FtZSBjb21iaW5hdGlvbiBvZiBhbGxlbGVzIGFzIGZvdW5kIGluICYjODIyMDtiLCYjODIyMTsgd2hpY2ggc2hvd3MgdGhlIG9yaWdpbmFsIHBhcmVudGFsIGNocm9tb3NvbWVzIChiZWZvcmUgYW55IGNyb3NzaW5nIG92ZXIgcmVzdWx0aW5nIGZyb20gbWVpb3Npcyku[Qq]
[q] The diagram below shows the results of a test cross between a female whose genotype is b+b+ vg+ vg+ and a male with genotype b b vg vg. If step “d” hadn’t occurred, there would be [hangman] phenotype classes in the offspring (instead of [hangman]).
[c]dHdv[Qq]
[c]Zm91cg==[Qq]
[q] The diagram below shows the results of a test cross between a female whose genotype is b+b+ vg+ vg+ and a male with genotype b b vg vg. 83% of the offspring have a [hangman] phenotype, while 17% have a [hangman] phenotype. The latter are a product of [hangman] [hangman] between homologous chromosomes that occurs during the first division of [hangman].
[c]cGFyZW50YWw=[Qq]
[c]cmVjb21iaW5hbnQ=[Qq]
[c]Y3Jvc3Npbmc=[Qq]
[c]b3Zlcg==[Qq]
[c]bWVpb3Npcw==[Qq]
[/qwiz]
6. Recombination Frequency and Chromosome Mapping
Through determining recombination frequencies between alleles in crosses like the one described above, Morgan and his team were able to create the first chromosome maps: diagrams showing the linear sequence of genes on a chromosome (like the one shown below). These early maps are also called linkage maps, because they were based on linkage analysis and recombination frequencies.

The units in a linkage map are called map units or centiMorgans (honoring Morgan). Each unit corresponds to a 1% frequency of recombination. For example, the black body gene and the vestigial wing gene are 17 map units apart. While we know that because it was the focus of the previous section, you can also look it up on the map. Start by finding the map unit location for vestigial wings. It’s 65.5. Now subtract 48.5, (the map unit location of the black body gene) and we we get 17.0. That corresponds with the 17% recombination frequency we saw when b+b vg+ vg is crossed with b b vg vg (and it was derived from that recombination frequency).
On the other side of the black body gene is a mutant gene for short aristae (bristled appendages on the head). This gene is at position 0. From that, you know that the allele for short aristae recombines with the black body gene 48.5% of the time (because it’s 48.5 map units away). The map also shows that between the black body gene and the vestigial wing gene is a gene for Cinnabar eyes (extremely bright red eyes). Cinnabar is located 9 units above the black body gene, and 8 units below the vestigial wing gene.
How were the positions of these genes figured out?
It was done by looking at relationships between recombination frequencies of linked genes. Here’s an example.
From recombination experiments, it was determined that the distance between b and vg was 17 map units.
![]()
Another cross showed that the distance between cn (the gene for cinnabar eyes) and b was about 8 map units.

That allows for two possibilities. Each one is a hypothesis about the position of these genes on the chromosome.
HYPOTHESIS # 1 looks like this:

We already know that the distance between b and vg is 17 units, so, in that case, the distance between cn and vg would have to be about 25 map units (8 + 17 = 25).
or
HYPOTHESIS # 2:

If this were the order, then the distance between cn and vg would have to be about 9 units That’s because we already know that the distance between b and vg is 17 units and 17 – 8 = 9.
Which hypothesis is correct? We can determine the answer by crossing cn+cn vg+ vg x cn cn vg vg. If the recombination frequency is about 25%, then we know that hypothesis # 1 is correct. If the recombination frequency is 9 units, we go with hypothesis # 2.
As it turns out, it’s hypothesis 2 that was correct.
Linkage maps are not physical maps. The “distance” shown in a linkage map corresponds to recombination frequencies, not numbers of nucleotides or nanometers along the length of a chromosome. But the order of genes generated by linkage mapping has been shown to be correct and has been confirmed by DNA sequencing technologies that emerged in the 1990s, and which are widely in use today.
A few additional points about these maps
- The closer two genes are, the more tightly linked they are. That’s because two genes will only recombine when there’s a crossover that happens in between them. Looking at the Drosophila linkage map in Figure 2 above, you can conclude that the chance of black body and cinnabar eyes (which are 8 units apart) being separated during meiosis 1 is much lower than the chance that short aristae and cinnabar eyes will be separated (because they’re 57.5 units apart).
- Because the map units are based on recombination frequencies and not physical distance, the numbers don’t always perfectly add up. When solving linkage problems or interpreting linkage maps, don’t let tiny discrepancies scare you into choosing a wrong answer.
- Any two genes that are more than 50 map units apart behave as if they’re on different chromosomes and independently assorting. The only way that we know that they’re linked is because they’re linked to other, closer genes.
7. Linked Genes, Linkage Mapping, and Recombination: Checking Understanding
[qwiz random = “false” qrecord_id=”sciencemusicvideosMeister1961-Linked genes, linkage mapping, and recombination quiz”]
[h]Linked Genes, Linkage Mapping, and Recombination Quiz
[i]
[q multiple_choice=”true”]Here’s a very schematic diagram showing five genes in an F1 hybrid.
Which of the following pairs of genes would recombine the most?
[c]QSBhbmQgQg==[Qq]
[f]Tm8uIEZvciByZWNvbWJpbmF0aW9uIHRvIGhhcHBlbiwgdGhlcmUgaGFzIHRvIGJlIGNyb3NzaW5nIG92ZXIgYmV0d2VlbiB0aGUgZ2VuZXMuIFRoZXJlJiM4MjE3O3MgYSBsb3Qgb2YgZGlzdGFuY2UgYmV0d2VlbiBBIGFuZCBCLCBzbyBjcm9zc2luZyBvdmVyIGNvdWxkIGhhcHBlbi4gQnV0IHRoZXJlJiM4MjE3O3MgZXZlbiBtb3JlIGRpc3RhbmNlIGJldHdlZW4gc29tZSBvZiB0aGUgb3RoZXIgY2hvaWNlcyBvbiB0aGlzIGxpc3Qu[Qq]
[c]QiBhbmQgQw==[Qq]
[f]Tm8uIEZvciByZWNvbWJpbmF0aW9uIHRvIGhhcHBlbiwgdGhlcmUgaGFzIHRvIGJlIGNyb3NzaW5nIG92ZXIgYmV0d2VlbiB0aGUgZ2VuZXMuIEIgYW5kIEMgYXJlIHJpZ2h0IG5leHQgdG8gb25lIGFub3RoZXIsIHNvIHRoZXJlIHdvdWxkIGhhdmUgdG8gYmUgY3Jvc3Npbmcgb3ZlciBpbiB0aGF0IHRpbnkgc3BhY2UgYmV0d2VlbiBCIGFuZCBDIGZvciB0aGVpciBhbGxlbGVzIHRvIHJlY29tYmluZS4gRmluZCB0aGUgdHdvIGdlbmVzIHdpdGggdGhlIG1vc3QgZGlzdGFuY2UgYmV0d2VlbiB0aGVtLg==[Qq]
[c]QyBhbmQgRA==[Qq]
[f]Tm8uIEZvciByZWNvbWJpbmF0aW9uIHRvIGhhcHBlbiwgdGhlcmUgaGFzIHRvIGJlIGNyb3NzaW5nIG92ZXIgYmV0d2VlbiB0aGUgZ2VuZXMuIFRoZXJlJiM4MjE3O3MgYSBsb3Qgb2YgZGlzdGFuY2UgYmV0d2VlbiBDIGFuZCBELCBzbyBjcm9zc2luZyBvdmVyIA==Y291bGQ=IGhhcHBlbi4gQnV0IHRoZXJlJiM4MjE3O3MgZXZlbiBtb3JlIHNwYWNlIGJldHdlZW4gc29tZSBvZiB0aGUgb3RoZXIgY2hvaWNlcyBvbiB0aGlzIGxpc3Qu[Qq]
[c]QSBhbm QgRA==[Qq]
[f]RXhjZWxsZW50LiBGb3IgcmVjb21iaW5hdGlvbiB0byBoYXBwZW4sIHRoZXJlIGhhcyB0byBiZSBjcm9zc2luZyBvdmVyIGJldHdlZW4gdGhlIGdlbmVzLiBPZiB0aGUgY2hvaWNlcyBwcm92aWRlZCwgZ2VuZXMgQSBhbmQgRCBoYXZlIHRoZSBtb3N0IGRpc3RhbmNlIGJldHdlZW4gdGhlbSwgYW5kIHRoZWlyIGFsbGVsZXMgYXJlIHRoZSBtb3N0IGxpa2VseSB0byByZWNvbWJpbmUu[Qq]
[q multiple_choice=”true”]Here’s a very schematic diagram showing five genes in an F1 hybrid. Which of the following pairs of genes would have the lowest recombination frequency?
[c]QSBhbmQgQg==[Qq]
[f]Tm8uIFJlY29tYmluYXRpb24gZnJlcXVlbmN5IGlzIGEgbWVhc3VyZSBvZiBob3cgb2Z0ZW4gdGhlIGFsbGVsZXMgaW4gdHdvIGxpbmtlZCBnZW5lcyB3aWxsIHJlY29tYmluZS4gVGhlIGZ1cnRoZXIgYXdheSB0d28gZ2VuZXMgYXJlLCB0aGUgbW9yZSBsaWtlbHkgaXQgaXMgdGhhdCB0aGVyZSB3aWxsIGJlIGEgY3Jvc3Npbmctb3ZlciBldmVudCBiZXR3ZWVuIHRoZXNlIHR3byBhbGxlbGVzLCBjYXVzaW5nIHJlY29tYmluYXRpb24uIENvbnZlcnNlbHksIHRoZSBjbG9zZXIgdHdvIGdlbmVzIGFyZSwgdGhlIGxlc3MgbGlrZWx5IGl0IGlzIHRoYXQgdGhlcmUgd2lsbCBiZSBjcm9zc2luZyBvdmVyIGJldHdlZW4gdGhlbS4gV2hpY2ggb2YgdGhlIGdlbmVzIGxpc3RlZCBhcmUgY2xvc2VzdCB0byBvbmUgYW5vdGhlciwgYW5kIGhlbmNlIGxlYXN0IGxpa2VseSB0byByZWNvbWJpbmU/[Qq]
[c]QiBhbm QgQw==[Qq]
[f]TmljZSEuIEIgYW5kIEMgYXJlIHRoZSBjbG9zZXN0IHRvZ2V0aGVyLCBtYWtpbmcgdGhlbSB0aGUgbW9zdCB0aWdodGx5IGxpbmtlZCwgYW5kIHRoZSBsZWFzdCBsaWtlbHkgdG8gcmVjb21iaW5lLg==[Qq]
[c]QyBhbmQgRA==[Qq]
[f]Tm8uIFJlY29tYmluYXRpb24gZnJlcXVlbmN5IGlzIGEgbWVhc3VyZSBvZiBob3cgb2Z0ZW4gdGhlIGFsbGVsZXMgaW4gdHdvIGxpbmtlZCBnZW5lcyB3aWxsIHJlY29tYmluZS4gVGhlIGZ1cnRoZXIgYXdheSB0d28gZ2VuZXMgYXJlLCB0aGUgbW9yZSBsaWtlbHkgaXQgaXMgdGhhdCB0aGVyZSB3aWxsIGJlIGEgY3Jvc3Npbmctb3ZlciBldmVudCBiZXR3ZWVuIHRoZXNlIHR3byBhbGxlbGVzLCBjYXVzaW5nIHJlY29tYmluYXRpb24uIENvbnZlcnNlbHksIHRoZSBjbG9zZXIgdHdvIGdlbmVzIGFyZSwgdGhlIGxlc3MgbGlrZWx5IGl0IGlzIHRoYXQgdGhlcmUgd2lsbCBiZSBjcm9zc2luZyBvdmVyIGJldHdlZW4gdGhlbS4gV2hpY2ggb2YgdGhlIGdlbmVzIGxpc3RlZCBhcmUgY2xvc2VzdCB0byBvbmUgYW5vdGhlciwgYW5kIGhlbmNlIGxlYXN0IGxpa2VseSB0byByZWNvbWJpbmU/[Qq]
[c]QiBhbmQgRQ==[Qq]
[f]Tm8uIFJlY29tYmluYXRpb24gZnJlcXVlbmN5IGlzIGEgbWVhc3VyZSBvZiBob3cgb2Z0ZW4gdGhlIGFsbGVsZXMgaW4gdHdvIGxpbmtlZCBnZW5lcyB3aWxsIHJlY29tYmluZS4gVGhlIGZ1cnRoZXIgYXdheSB0d28gZ2VuZXMgYXJlLCB0aGUgbW9yZSBsaWtlbHkgaXQgaXMgdGhhdCB0aGVyZSB3aWxsIGJlIGEgY3Jvc3Npbmcgb3ZlciBldmVudCBiZXR3ZWVuIHRoZXNlIHR3byBhbGxlbGVzLCBjYXVzaW5nIHJlY29tYmluYXRpb24uIENvbnZlcnNlbHksIHRoZSBjbG9zZXIgdHdvIGdlbmVzIGFyZSwgdGhlIGxlc3MgbGlrZWx5IGl0IGlzIHRoYXQgdGhlcmUgd2lsbCBiZSBjcm9zc2luZyBvdmVyIGJldHdlZW4gdGhlbS4gV2hpY2ggb2YgdGhlIGdlbmVzIGxpc3RlZCBhcmUgY2xvc2VzdCB0byBvbmUgYW5vdGhlciwgYW5kIGhlbmNlIGxlYXN0IGxpa2VseSB0byByZWNvbWJpbmU/[Qq]
[q]Linked genes don’t obey Mendel’s rule of [hangman] [hangman]. When they do separate, it’s because of [hangman] [hangman] during meiosis.
[c]aW5kZXBlbmRlbnQ=[Qq]
[c]YXNzb3J0bWVudA==[Qq]
[c]Y3Jvc3Npbmc=[Qq]
[c]b3Zlcg==[Qq]
[q]Based on the data below what’s the most likely linkage map?
| Genes | Recombination frequency in % |
| s and t | 2% |
| t and u | 3% |
| s and u | 1% |
[c]IHMmIzgyMzA7LnUmIzgyMzA7LnQ=[Qq]
[f]Tm8uIHMgaXMgMiBtYXAgdW5pdHMgZnJvbSB0LiB0IGlzIDMgbWFwIHVuaXRzIGZyb20gdS4=
Cg==RHJhdyB0aGVtIG91dCBsaWtlIHRoaXM6IHMuLjIuLnUuLjMuLnQuwqA=
[Qq]Based on that hypothesis, the distance between s and t would have to be 5 units. But the data says that it’s only 2 units. Choose again.
[c]IHQmIzgyMzA7cy YjODIzMDsudQ==[Qq]
[f]RXhjZWxsZW50LiB0IGlzIDIgdW5pdHMgZnJvbSBzLCB3aGljaCBpcyAxIHVuaXQgZnJvbSB1Lg==
Cg==SWYgeW91IGRyYXcgdGhlbSBsaWtlIHRoaXMgdCYjODIzMDsyJiM4MjMwO3MuLjEmIzgyMzA7dSwgdGhlbiB5b3UmIzgyMTc7ZCBleHBlY3QgdGhlIGRpc3RhbmNlIGJldHdlZW4gdCBhbmQgdSB0byBiZSAzIG1hcCB1bml0cywgd2hpY2ggaXQgaXMu[Qq]
[c]IHUmIzgyMzA7dCYjODIzMDsucw==[Qq]
[f]Tm8uIExvb2tpbmcgYXQgdGhlIGRpc3RhbmNlcyBpbiB0aGUgdGFibGUsIHlvdSYjODIxNztkIGRyYXcgdGhpcyBvdXQgYXM=
Cg==dSYjODIzMDszJiM4MjMwO3QuLjIuLnMuIFRoaXMgbW9kZWwgcHJlZGljdHMgdGhhdCB0aGUgZGlzdGFuY2UgYmV0d2VlbiB1IGFuZCBzIHdvdWxkIGJlIDUgdW5pdHMsIGJ1dCB0aGUgZGF0YSBzYXlzIGl0JiM4MjE3O3Mgb25seSBvbmUgdW5pdC4gQ2hvb3NlIGFnYWluLg==[Qq]
[q]Based on the data below, draw a linkage map.
| Genes | Map Units (centiMorgans) |
| d and c | 10 cM |
| c and a | 13 cM |
| a and d | 3 cM |
| b and c | 18 cm |
| b and d | 8 cm |
[c]U2hvdyB0aG UgYW5zd2Vy[Qq]
[f]YuKApjUgY03igKYuIC5h4oCmM2NN4oCmLmTigKYmIzgyMzA7JiM4MjMwOyYjODIzMDsuMTBjTeKApuKApi4uYw==
Cg==SGVyZSYjODIxNztzIGhvdyBJIGZpZ3VyZWQgdGhpcyBvdXQu
Cg==- Cg==
- [Qq]I placed b and c, which are 18 cM apart, on the outside end of the sequence.
b………………………….18…………………………………c - I noticed that a and c are 13 apart, and I slotted a in as follows.
b…………..5……………..a………………13………………..c
That means that the distance between a and b must be 5 cM - I notice that d and c are 10 apart. Slotting d in between a and c gives me
b…………..5……………..a….3…..d………10………………..c
and I notice that this agrees with all the other data points.
[q]Genes “R” and “S” are 28 map units apart on the same chromosome in an F1 dihybrid individual.
What are the frequencies of the following gametes?
RS, Rs, rS, rs
[c]U2hvdyB0aG UgYW5zd2Vy[Qq]
[f]SW4gYW4gRg==MQ==IGh5YnJpZCwgdGhlIGFsbGVsZXMgYXJlIGdvaW5nIHRvIGJlIG9yZ2FuaXplZCBsaWtlIHRoaXM6
Cg==[Qq]
RS and rs are the parental gametes.
The frequency of each will be (100 – 28)/2, which is 36%.
rS and Rs are the recombinant gametes (the ones resulting from crossing over. If the recombination frequency is 28%, then the frequency of each of these recombinant phenotypes will be about half of that or 14%.
[q]In a newly discovered species of insect, a is the mutant allele for no antennae, and b is the mutant allele for no bristles. The wildtype versions of these alleles code for having antennae (a+) and bristles (b+)
An organism with genotype a+a b+ b is test crossed with aabb, and the following genotypes are observed in their offspring.
- antennae, no bristles: 135
- antennae and bristles: 430
- no antennae, no bristles: 390
- no antennae, bristles: 120
What’s the recombination frequency?
[c]U2hvdyB0aG UgYW5zd2Vy[Qq]
[f]
Cg==VGhlIHJlY29tYmluYW50cyBhcmUgdGhlIGluZGl2aWR1YWxzIHdpdGggcGhlbm90eXBlcyAxIGFuZCA0OiBUaGVpciB0b3RhbCBpcyAyNTUuIDI1NS8xMDc1ID0gMjMuNyUsIHdoaWNoIGlzIHRoZSByZWNvbWJpbmF0aW9uIGZyZXF1ZW5jeS4=[Qq]
[q]In the diagram below, cross 1 is demonstrating [hangman] [hangman], while Cross 2 is showing genes that are [hangman].
[c]aW5kZXBlbmRlbnQ=[Qq]
[c]YXNzb3J0bWVudA==[Qq]
[c]bGlua2Vk[Qq]
[q]In the diagram below, the recombinant offspring in cross 2 are the result of [hangman] [hangman] that occurs during [hangman] 1 of Meiosis I
[c]Y3Jvc3Npbmc=[Qq]
[c]b3Zlcg==[Qq]
[c]cHJvcGhhc2U=[Qq]
[q]In both Cross 1 and Cross 2 in the diagram below, the cell indicated by letter “A” is a female [hangman] cell. In both crosses, letters “C,” “D,” “E,” and “F” represent female [hangman]. With a single set of chromosomes, these cells can also be described as being [hangman]. Fertilization of these egg cells by the [hangman] cell at “G” will result in the zygotes shown at 1 through 4, each of which is [hangman] (with two chromosome sets).
[c]Z2VybQ==[Qq]
[c]Z2FtZXRlcw==[Qq]
[c]aGFwbG9pZA==[Qq]
[c]c3Blcm0=[Qq]
[c]ZGlwbG9pZA==[Qq]
[q]In the diagrams below, the offspring represented by “1” and “2” have [hangman] phenotypes, while those represented by “3” and “4” have [hangman] phenotypes.
[c]cGFyZW50YWw=[Qq]
[c]cmVjb21iaW5hbnQ=[Qq]
[/qwiz]
Links
- χ2 (Chi-Squared) Tutorial (the next tutorial in this genetic series)
- Genetics Main Menu
