1. Some Population Genetic Analysis to Get Us Started
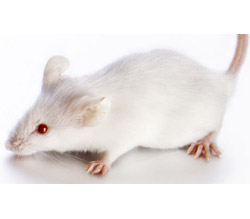
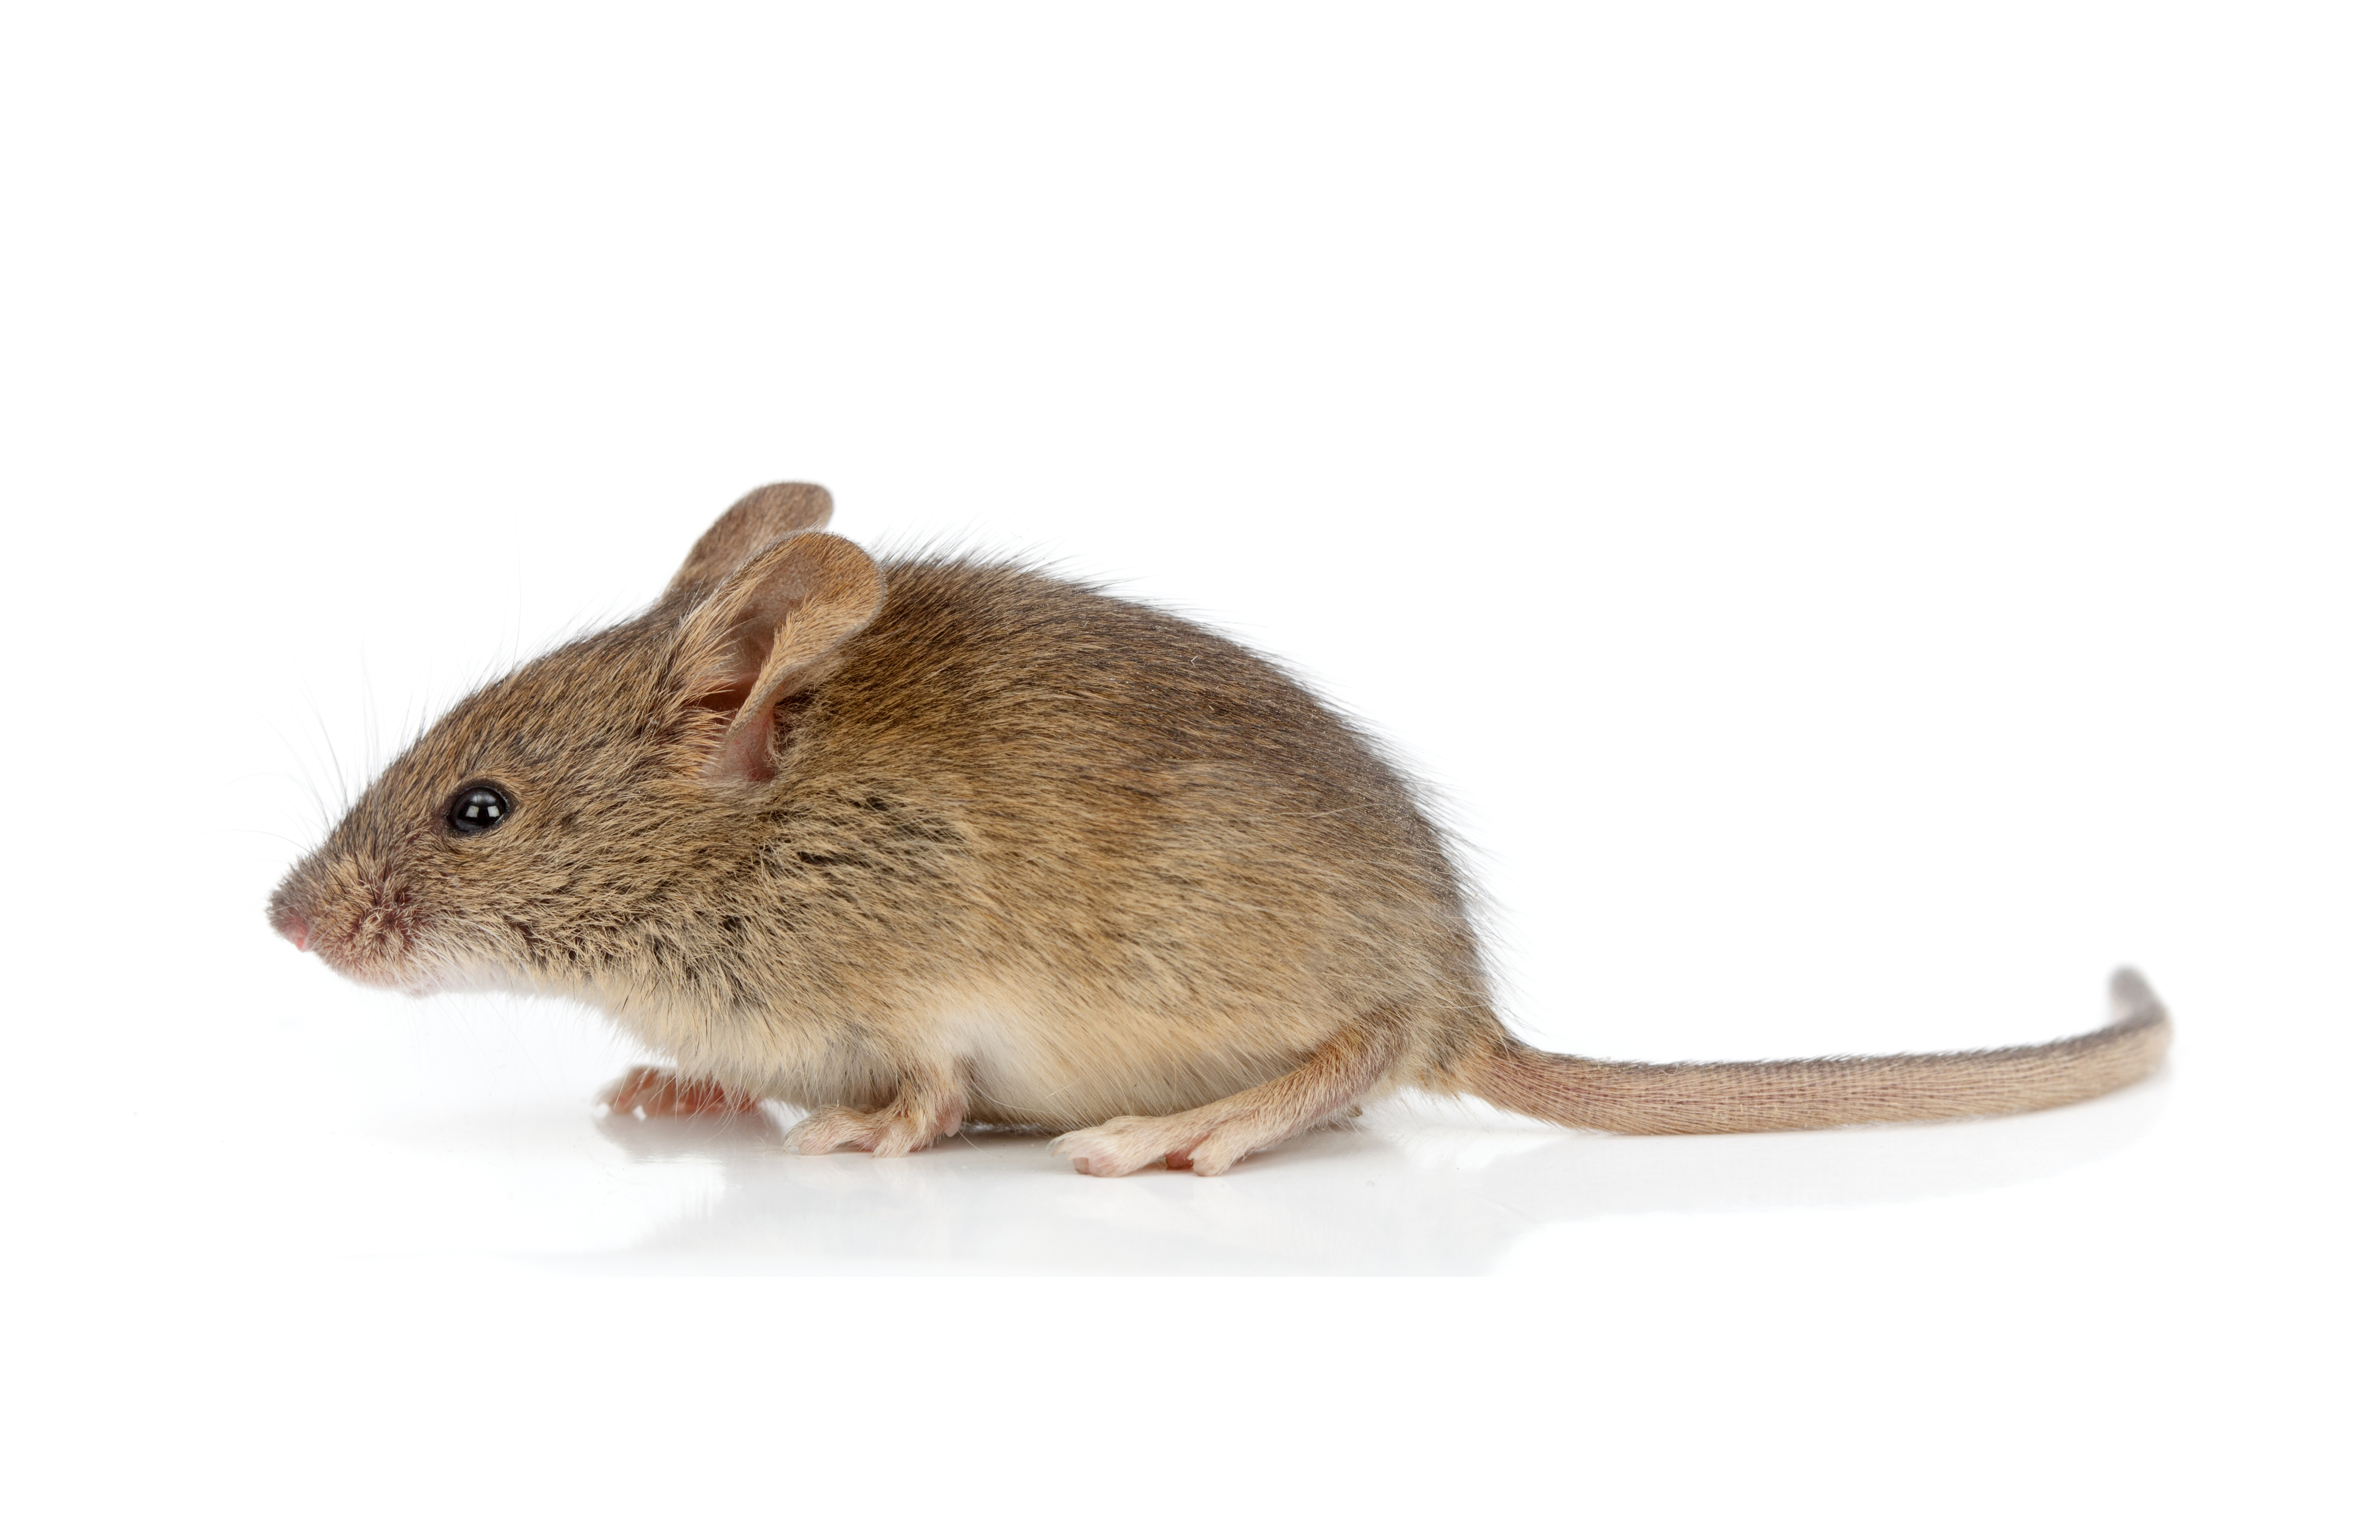
In the last tutorial, we counted allele frequencies of a small population of mice, some of which were albino, and others with normal coloration. Because albinism is caused by a recessive allele, a, we know that the only mice that will show the albino phenotype are the ones with the genotype aa. Pigmented mice can have either the genotype AA or Aa.
|
|
|
- The “a” allele
- The “A” allele
- Homozygous recessive individuals (genotype “aa”).
- Heterozygotes (genotype “Aa”)
- Homozygous dominant individuals (genotype “AA”).
To help you in this analysis, note that if the total population size is 200, that means that there are 400 alleles in this slice of the mouse gene pool (each mouse has two alleles, one from each parent).
Note that it might be easier to do this analysis on paper. If you want to print out a paper version of this gene pool, here’s a link to a PDF version of the table below.
| aa | aa | AA | Aa | aa | AA | aa | Aa | aa | Aa | aa | aa | AA | aa | aa |
| AA | aa | aa | Aa | aa | Aa | aa | aa | aa | Aa | aa | Aa | aa | aa | Aa |
| Aa | AA | aa | aa | Aa | aa | Aa | aa | aa | Aa | aa | aa | Aa | aa | Aa |
| aa | Aa | aa | Aa | Aa | Aa | Aa | aa | AA | Aa | Aa | aa | Aa | aa | aa |
| aa | aa | Aa | aa | aa | Aa | aa | Aa | aa | aa | Aa | aa | aa | Aa | AA |
| aa | aa | aa | Aa | Aa | aa | AA | aa | Aa | aa | aa | Aa | aa | aa | Aa |
| Aa | aa | Aa | AA | aa | Aa | aa | Aa | aa | Aa | aa | Aa | aa | aa | Aa |
| aa | Aa | aa | aa | Aa | aa | Aa | aa | aa | aa | AA | aa | Aa | Aa | Aa |
| Aa | aa | AA | Aa | aa | Aa | aa | Aa | aa | Aa | aa | Aa | aa | Aa | Aa |
| Aa | Aa | aa | Aa | AA | Aa | Aa | aa | Aa | aa | Aa | aa | Aa | aa | Aa |
| aa | Aa | Aa | aa | Aa | aa | Aa | AA | aa | Aa | aa | Aa | aa | Aa | aa |
| Aa | Aa | Aa | aa | aa | Aa | Aa | aa | Aa | aa | AA | Aa | aa | Aa | aa |
| aa | Aa | aa | Aa | Aa | aa | Aa | Aa | aa | aa | aa | aa | aa | AA | aa |
| AA | Aa | Aa | AA | AA |
1.a. Population Genetics Analysis Task 1
[qwiz qrecord_id=”sciencemusicvideosMeister1961-Model Gene Pool Analysis (v2.0)”]
[h]Model Gene Pool Analysis
[q]Analyze the gene pool above, and gather the following data
| allele or genotype | fraction | decimal |
| a | X/400 | 0.____ |
| A | X/400 | 0.____ |
| aa | X/200 | 0.____ |
| Aa | X/200 | 0.____ |
| AA | X/200 | 0.____ |
[c]U2hvdyB0aGUgYW5zd2Vy[Qq]
[f]
Cg==| [Qq]allele or genotype | fraction | decimal |
| a | 280/400 | 0.7 |
| A | 120/400 | 0.3 |
| aa | 98/200 | 0.49 |
| Aa | 84/200 | 0.42 |
| AA | 18/200 | 0.09 |
[/qwiz]
1.b. Population Genetics Analysis Task 2
[qwiz qrecord_id=”sciencemusicvideosMeister1961-Gene Pools, Key Relationships (v2.0)”]
[h]Gene Pools: Key Relationships
[q]Now, take a good long look at the answers above, and see if any relationships pop out at you. Write them down, and compare your answers to mine.
[c]U2hvdyB0aGUgYW5zd2Vy[Qq]
[f]IEhlcmUgYXJlIGEgZmV3IHRoaW5ncyB0aGF0IHlvdSBtaWdodCBoYXZlIG5vdGljZWQu
- Cg==
- VGhlIGZyZXF1ZW5jeSBvZiAmIzgyMjA7YSYjODIyMTsgKyB0aGUgZnJlcXVlbmN5IG9mICYjODIyMDtBJiM4MjIxOyA9IDEuMC4gSW4gb3RoZXIgd29yZHMsIDAuMyArIDAuNyA9IDEuIFRoYXQgbWFrZXMgc2Vuc2UsIGJlY2F1c2UgaWYgMzAlIG9mIHRoZSBhbGxlbGVzIGZvciBhIGdlbmUgYXJlIHRoZSByZWNlc3NpdmUgYWxsZWxlLCB0aGVuIHRoZSByZXN0IGhhdmUgdG8gYmUgdGhlIGRvbWluYW50IGFsbGVsZS4= Cg==
- [Qq]The frequency of “AA” (0.09) + the frequency of “Aa” (0.42) + the frequency of “aa” (0.49) = 1. That makes sense, too, because that means that the frequency of every possible genotype adds up to 100% of the individuals in the population.
- The frequency of “a” squared = the frequency of “aa.” In other words, in the example above, 0.72 = 0.49. We’ll see that this is, in fact, one of the most important keys to solving population genetics-related problems.
- If you were unbelievably good at seeing mathematical relationships, you might have noticed that the frequency of heterozygotes (0.42) is equal to the frequency of the dominant allele (0.3) times the frequency of the recessive allele (0.7) times two.
[/qwiz]
2. Population Genetic Analysis is about counting the Ps and the Qs
In 1908, the mathematician G.H. Hardy and the obstetrician Wilhelm Weinberg independently published papers describing the key principles of population genetics. Their work mathematically describes the relationships between the alleles, genotypes, and certain phenotypes in a population’s gene pool. Note, however, that these relationships only apply to a population that’s in equilibrium. In an evolutionary context, equilibrium means roughly the same as non-evolving. In other words, these are gene pools in which allele frequencies are staying the same over time. In later tutorials in this series, we’ll explore the conditions that allow gene pools to remain in equilibrium, and (more interestingly) the conditions that cause gene pools to change.
In the notation that’s typically used to represent Hardy and Weinberg’s work, p represents the frequency of the dominant allele, and q represents the frequency of the recessive allele.
As you’ve discovered above, p + q = 1. In plain English, that means that the frequency of the dominant allele + the frequency of the recessive allele = 100% of the alleles for that gene in the population.
Now, that probably seems pretty obvious. But let’s take that expression, and square both sides:
(p + q)(p+q) = 1 * 1
What you get is
p2 + 2pq +q2 = 1
That might not seem like a big deal, but this expression is astoundingly useful. That’s because, in this ideal, non-evolving, population:
- p2 is the frequency of individuals who are homozygous dominant (such as AA, in our population above)
- 2pq is the frequency of heterozygotes (such as Aa)
- q2 is the frequency of homozygous recessives (such as aa).
The frequency of homozygous recessives is the key. That’s because the homozygous recessive phenotype has a known genotype. If you see an individual with a recessive phenotype, you know that individual’s genotype. For example, think of the mice in the sample population above. Because the albino allele (a) is recessive, any albino mouse has to have the genotype “aa.” If you count the frequency of albino mice, you know one of the expressions in the Hardy-Weinberg equation (q2). From there, you can figure out q (just by taking the square root of q2). And from there, you can figure out many other things about that population’s genetic structure (at least, for that gene).
Again, let’s turn back to our population of 200 mice above. You discovered, through counting, that the frequency of albino mice (homozygous recessive mice with the “aa” genotype) was 0.49.
- That means that q2 = 0.49.
- If you want to know q (the frequency of the recessive allele) just take the square root of 0.49. That’s 0.7
- Since p + q = 1, that means that the frequency of “A” has to be 1.0 – 0.7, which equals 0.3.
- Since the frequency of heterozygotes is 2pq, you can calculate that 2 * 0.3 * 0.7 = 0.42 (which means that heterozygotes should make up 42% of the population).
- And, you can also calculate that the expected frequency of homozygous dominant individuals should be 0.32, or 0.09.
That’s a pretty high yield from two equations! But let’s spend a few moments with flashcards to get these symbols and equations memorized.
[qdeck bold_text=”false” qrecord_id=”sciencemusicvideosMeister1961-Hardy-Weinberg Equation Flashcards (v2.0)”]
[h] Hardy-Weinberg Equation Flashcards
[i] The Hardy-Weinberg Equations
[start]
[q] Just thinking of the dominant and recessive allele for one gene in a gene pool, what’s the simplest expression of the Hardy-Weinberg equation?
[a]
p + q = 1
[q] What’s the expression of the Hardy-Weinberg equation that includes homozygous dominant, homozygous recessives, and heterozygotes?
[a]
p2 + 2pq + q2 = 1
[q] In the Hardy-Weinberg equation, p stands for
[a]
In the Hardy-Weinberg equation, p stands for the frequency of the dominant allele.
[q] In the Hardy-Weinberg equation, q stands for
[a]
In the Hardy-Weinberg equation, q stands for the frequency of the recessive allele.
[q] In the Hardy-Weinberg equation, q2 stands for the frequency of
[a]
In the Hardy-Weinberg equation, q2 stands for the frequency of individuals that are homozygous recessive (and, who show the recessive phenotype).
[q] In the Hardy-Weinberg equation, p2 stands for
[a]
In the Hardy-Weinberg equation, p2 stands for the frequency of individuals who are homozygous dominant.
[q] In the Hardy-Weinberg equation, 2pq stands for the frequency of
[a]
In the Hardy-Weinberg equation, 2pq stands for the frequency of heterozygotes.
[q] When using the Hardy-Weinberg equation to analyze a gene in a population’s gene pool, the observable quantity that will let you figure out everything else is…
[a]
When using the Hardy-Weinberg equation to analyze a gene in a population’s gene pool, the observable quantity that will let you figure out everything else is q2, which is the frequency of homozygous recessives. Once you have that, you can figure out q, then p, then everything else.
[q] What Hardy-Weinberg expression will give you the frequency of all of the individuals in the population that show the dominant phenotype?
[a]
The Hardy-Weinberg expression that shows the frequency of individuals who show the dominant phenotype is p2 + 2pq (which is all the homozygous dominants, plus the heterozygotes)
[x] If you’ve mastered all of these terms, you’re ready to move on. Otherwise, run through these flashcards again.
[restart]
[/qdeck]
3. Use Cross-Multiplication Tables!
When solving population genetics problems involving the Hardy-Weinberg equation, you’ll make your life much easier (and your test scores much higher) if you use cross-multiplication tables. It’s MUCH simpler than solving for any of the variables in the equation p2 + 2pq + q2 = 1. Let me show you how these work.
Using the symbols of the Hardy-Weinberg equation, here’s what a cross-multiplication table looks like:
| p | q | |
| p | p2 | pq |
| q | pq | q2 |
So let’s walk through the steps of how you’d use this to solve population genetics problems.
STEP 1: Draw a Punnett square.
| A | A | |
| A | ||
| A |
STEP 2: Place the alleles you’re analyzing on the sides and inner squares as if this were a monohybrid cross (Aa x Aa)
| A | a | |
| A | AA | Aa |
| a | Aa | aa |
STEP 3: Now, as a proof of concept, let’s add the values for p and q from our sample mouse gene pool above.
| A (0.3) | a (0.7) | |
| A (0.3) | AA | Aa |
| a (0.7) | Aa | aa |
STEP 4: Notice that if you cross multiply, you can find the values of p2, q2, and pq.
| A (0.3) | a (0.7) | |
| A (0.3) | AA (0.09) | Aa (0.21) |
| a (0.7) | Aa (0.21) | aa (0.49) |
And, of course, if you had any value, you can simply use the functions on your calculator to find all the rest. For example, let’s say that by observing a population, you discovered that the frequency of homozygous recessives is 4%, or 0.04. The frequency of homozygous recessives is q2, so just plug that into the bottom right corner, where q2 goes.
| A ____ | a _____ | |
| A ___ | AA _____ | Aa _____ |
| a ___ | Aa _____ | aa (0.04) |
Knowing that aa is 0.04, you take the square root of that to get the frequency of q.
| A ____ | a (0.2) | |
| A ___ | AA ___ | Aa ____ |
| a (0.2) | Aa ____ | aa (0.04) |
Now you can figure out p, because 1 – q = p (in this case, 1 – 0.2 = 0.8)
| A (0.8) | a (0.2) | |
| A (0.8) | AA (____) | Aa(____) |
| a (0.2) | Aa (____) | aa (0.04) |
And now cross multiply to figure out the rest.
| A (0.8) | a (0.2) | |
| A (0.8) | AA (0.64) | Aa (0.16) |
| a (0.2) | Aa (0.16) | aa (0.04) |
This means that from one value (the frequency of homozygous recessives, which was 0.04), we’ve been able to determine
- the frequency of the recessive allele (20%)
- the frequency of the dominant allele (80%)
- the frequency of heterozygotes (32%)
- the frequency of homozygous dominant (64%)
4. Solving Hardy-Weinberg Problems Using Cross-Multiplication Tables
These practice problems were inspired (or copied) from various websites including:
- http://www.k-state.edu/parasitology/biology198/hardwein.html
- http://biogirl757.weebly.com/uploads/3/9/6/8/39680816/hardy_weinberg_problem_set_key.pdf
[qdeck bold_text=”false” style=”min-height: 425px !important;” qrecord_id=”sciencemusicvideosMeister1961-Hardy-Weinberg Practice Problems (v2.0)”]
[h] Hardy-Weinberg Practice Problems Modeling Use of Cross Multiplication Tables
[i] Hardy-Weinberg Problems
[start]
[!!!!] problem 1 from http://www.k-state.edu/parasitology/biology198/hardwein.html[/!!!]
[q] In a population, the frequency of the homozygous recessive phenotype is 36%. Determine the frequency of
- the recessive allele
- the dominant allele
- homozygous dominants
- heterozygotes
[a] If the frequency of the recessive phenotype is 36%, then I’m going to put that in the lower right corner. From there, I’m figuring out everything else
| A (0.4) | a (0.6) | |
| A (0.4) | AA (0.16) | Aa (0.24) |
| a (0.6) | Aa (0.24) | aa (0.36) |
So, frequencies are as follows:
- the recessive allele: 0.6
- the dominant allele. 0.4
- homozygyous dominants: 0.16
- heterozygotes: 0.48
[!!!!] problem 2 from http://www.k-state.edu/parasitology/biology198/hardwein.html[/!!!]
[q] A study in an African nation estimated the frequency of individuals born with sickle cell anemia as 2.1%. What is the frequency of heterozygotes (individuals who don’t suffer the symptoms of sickle cell anemia, but, on account of possessing the allele, have some resistance to the parasite that causes malaria)?
[a] If the frequency of individuals born with the recessive phenotype is 2.1%, then I’m going to put that in the lower right corner. From there, I’m figuring out everything else
| A (0.855) | a (0.144) | |
| A (0.855) | AA (0.73) | Aa (0.123) |
| a (0.144) | Aa (0.123) | aa (0.021) |
So, 2 * 0.123 = 24% = frequency of heterozygotes.
[!!!!] problem 3 from http://www.k-state.edu/parasitology/biology198/hardwein.html[/!!!]
[q] In a population of butterflies, brown (B) is dominant over white (b). 40% of the butterflies are white. What are the percentages of
- the recessive allele
- the dominant allele
- homozygous dominants
- heterozygotes
[a] If the frequency of individuals born with the recessive phenotype is 40%, then I’m going to put that in the lower right corner. From there, I’m figuring out everything else
| A (0.368) | a (0.632) | |
| A (0.368) | AA (0.135) | Aa (0.232) |
| a (0.632) | Aa (0.232) | aa (0.4) |
So, frequencies are as follows:
- the recessive allele: 0.632
- the dominant allele. 0.368
- homozygous dominants: 0.135
- heterozygotes: 0.464
[!!!!] problem 4 from http://www.k-state.edu/parasitology/biology198/hardwein.html[/!!!]
[q] Cystic fibrosis is the most common inherited disease among North Americans of European ancestry. The disease is caused by a recessive allele. About 1 in 2500 babies are born with this condition. What percentage of the population are carriers?
[a] If the frequency of individuals born with the recessive phenotype is 1/2500, then I’m going to start by converting that into a percentage. 1/2500 is 0.0004. Now, I’m going to put that in the lower right corner. From there, I’m figuring out everything else
| A (0.98) | a (0.02) | |
| A (0.98) | AA | Aa (0.0196) |
| a (0.02) | Aa (0.0196) | aa (0.0004) |
0.0196 + 0.0196 = 0.039. That means that just under 4% of the population are carriers.
[!!!!] problem 5 from http://biogirl757.weebly.com/uploads/3/9/6/8/39680816/hardy_weinberg_problem_set_key.pdf
[/!!!]
[q] The frequency of two alleles in a gene pool is 0.19 (A) and 0.81 (a). What is the percentage of heterozygotes in the population? What’s the percentage of homozygous recessives?
[a] Just plug these values in as shown below
| A (0.19) | a (0.81) | |
| A (0.19) | AA | Aa (0.1539) |
| a (0.81) | Aa (0.1539) | aa (.6561) |
0.1539 +0.1539 = 0.3078. So, about 31% of the individuals in this population are heterozygotes. About 66% of the population is homozygous recessive.
[x] If you feel you can handle these problems with mastery, then please go on to the next tutorial. Otherwise, try them again
[restart]
[/qdeck]
What’s Next?
Proceed to Topics 7.4 -7.5, Part 3: The Hardy-Weinberg Principle (the next tutorial in AP Bio Topics 7.4 – 7.5, Population Genetics)