Curricular note from Mr. W. The College Board, in their 2025 AP Bio Course and Exam description, deemphasized the topic of extinction and completely dropped the topic of mass extinction. Given the importance of these topics, I hope you, nevertheless, choose to learn (or teach) about extinction.
1. Extinction is the flip side of speciation
There are as many as 8.7 million species alive on Earth today. But that number is a tiny fraction of all of the species that have lived during life’s 3.8 billion-year history. It’s estimated that as many as 5 billion species have inhabited the Earth at one point in time or another. 99.9% of these species are extinct.
Extinction happens for a variety of reasons. These include
- Disruption of a species’ habitat (where a species lives). That can occur through a variety of ecological or geological processes that change the climate and alter the landscape.
- Some ecological disturbance that interferes with how a species survives within its ecological niche (its way of making a living: a concept we’ll explore much more in AP Bio Unit 8, Ecology). Often, this disturbance involves a new competitor, predator, or parasite.
2. The Extinction Vortex
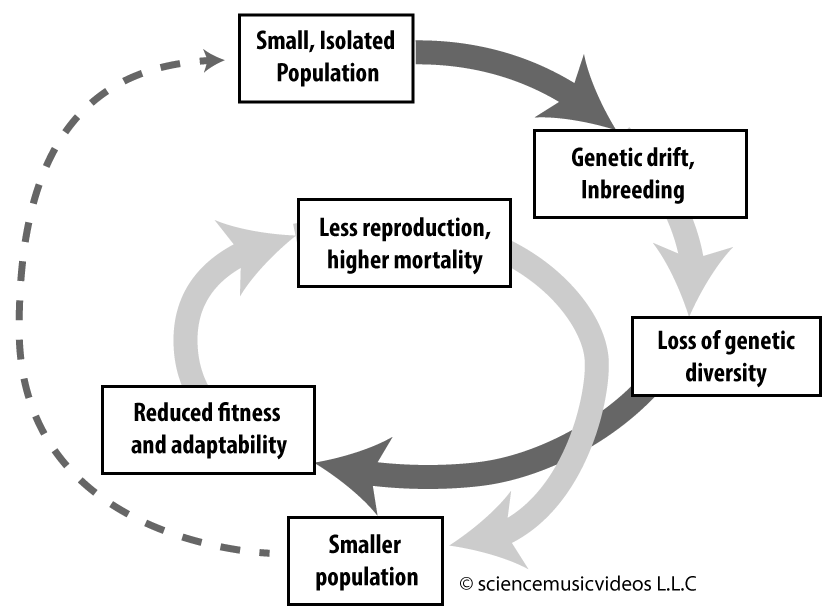 Species in decline can enter into what’s called an extinction vortex. A whirlpool above a drain is an example of a vortex. In the same way that a whirlpool pulls water down a drain, an extinction vortex pulls species toward extinction. The vortex works like this:
- Ecological disturbances make it difficult for a species to successfully survive in its habitat and niche. As a result, there’s a decrease in the population size.
- This lowered size leads to genetic drift and decreases genetic variability.
- Decreased variability makes the population less fit and adaptable
- Lowered fitness leads to higher mortality and a lower birth rate.
- Additional disturbances lead to further population decline.
Because the system is a positive feedback loop, species that enter the vortex often quickly decline toward extinction.
3. Extinction and the importance of genetic and phenotypic variability
The capacity to respond to adverse conditions is known as resilience. In relation to extinction, species that lose their genetic diversity become less resilient and less adaptable. That’s because genetic diversity is a key asset in a population’s ability to respond to environmental change. As the environment changes, a diverse population is more likely to contain individuals with phenotypes that enable them to survive in the new conditions, and thus pass their genes for these beneficial phenotypes on to future generations. Conversely, populations with little genetic diversity are less likely to be able to survive the selective pressure associated with environmental changes, putting them at higher risk for extinction.
4. The background level of extinction
Because of changes like the ones listed above, species are constantly becoming extinct. By looking at Earth’s history, it’s possible to calculate a background extinction rate. This is how often extinctions normally occur.
A widely quoted benchmark for the background extinction rate is 1 extinction per million species per year. Thus, if there are 8.7 million species on Earth, then we’d expect 8 species to become extinct each year. However, a 2014 study funded by the Society for Conservation Biology, estimated that this benchmark might be too high: in fact, the background level of extinction might be as low as 0.1 extinctions/million species/year.
Another way to talk about background extinction rate is to talk about species lifespans, or species survival rates. In the same way that we can talk about the average lifespan of a dog or a human being, it’s possible by looking at fossil data to determine how long a species can be expected to survive before becoming extinct. This varies for different taxa.
Here are a few species survival rates (source: Wikipedia)
- All invertebrates: 11 million years
- Mammals: 1 million years
- Echinoderms (sea stars, sea urchins, sand dollars, etc): 6 million years.
5. Mass extinction
Extinction is a normal part of the history of life on Earth. If the rate of speciation and the rate of extinction are equal, then overall species diversity remains constant. However, there have been periods in Earth’s history when geological and even astronomical forces cause environments throughout much of the planet to significantly change. This alters many species’ niches to the point where they can no longer survive. Because the change occurs on a widespread (and even a planetary scale), no migration to a place of refuge is possible. This leads to a mass die-off called a mass extinction.
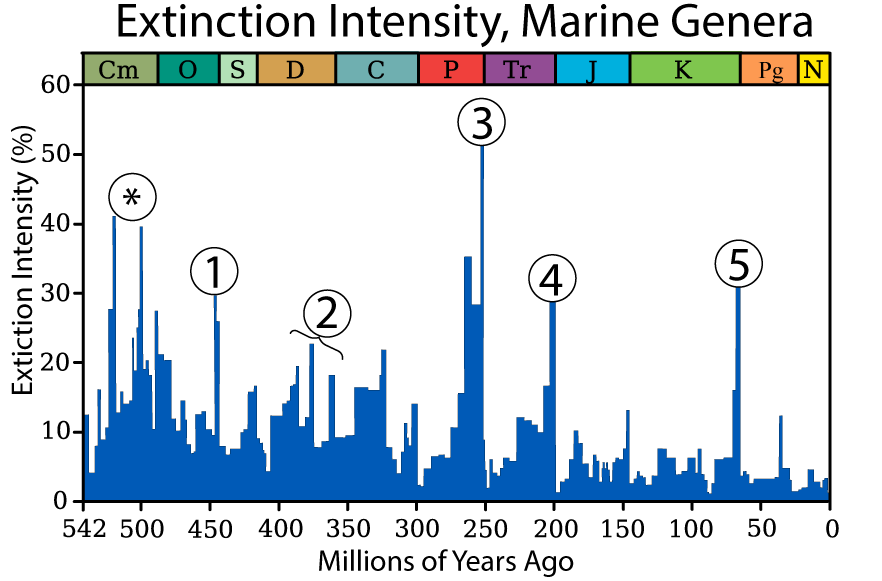 Five such mass extinctions have occurred since multicellular life emerged about 600 million years ago. You can see them as the peaks in the graph to the left.
The Y axis on this graph is extinction intensity. Extinction intensity, in this graph, is the percentage of genera (plural of “genus”) that were present at one period of time, but don’t exist afterward (because they became extinct). For example, find number 3 on the graph. The value is above 50%. What this indicates is that over 50% of the genera that were present at this time became extinct. Note that each genus can contain many species. This mass extinction, known as the Permian extinction, wiped out up to 95% of marine species and 70% of terrestrial species.
Two additional things to note about this graph:
- The values on this graph are based on marine species because these organisms are the ones with the best fossil record.
- Two mass extinctions occurred about 500 million years ago. These are marked with an asterisk because this was very close to the “Cambrian explosion” of animal diversity, and the fossil record at that point is poorly developed. Hence, these two mass extinctions aren’t usually counted among the other five.
What causes these mass extinctions? Let’s just look at two.
- Number 3 is called the Permian extinction. As the greatest of all mass extinctions, it’s sometimes referred to as the Great Dying. There’s no complete consensus on its cause. There might have been several factors that coincided to alter both marine and terrestrial environments in such a way that wiped out a huge swath of Earth’s species (including the trilobites described above). These factors include:
- Massive releases of carbon dioxide: In what’s currently Siberia (eastern Russia), a series of enormous volcanic eruptions released significant quantities of carbon dioxide into the air. These eruptions might have ignited sediments rich in coal and petroleum: that released additional carbon dioxide into the air. This carbon dioxide acted as a greenhouse gas, trapping heat and causing the planet’s temperature to become significantly warmer, altering environments and disrupting food chains around the globe.
- Poisoning of the oceans: Increased ocean temperatures reduced the amount of dissolved oxygen in the oceans. This oxygen reduction, along with higher temperatures, would have stressed marine organisms. On top of that, the reduction of oxygen could have led to a bloom of sulfate-reducing bacteria. These bacteria release hydrogen sulfide (H2S), a poisonous gas. The release of this gas would have killed off both marine and terrestrial species.
- Number 5 is the Cretaceous-Tertiary extinction (confusingly abbreviated as the K-T extinction). The cause of this extinction, which wiped out the dinosaurs (except for birds), is clear. About 65.5 million years ago, an asteroid about 10 kilometers in diameter (the size of Mount Everest) struck Earth in what’s now the Gulf of Mexico. This impact caused a variety of climate-related effects that disrupted terrestrial and marine food chains. In one account of the disaster (recounted in a fabulous episode of Radiolab called “Dinopocalypse”), debris from the impact flew into space and then rained down upon the Earth. The subsequent meteor shower superheated the Earth’s atmosphere, cooking the dinosaurs alive. Within a few hours, a clade that had dominated the Earth for hundreds of millions of years was wiped out. The only terrestrial animal species that would have survived would have been those with nests or burrows underground. For plants, it was those species that could resprout from underground roots or with seeds that could tolerate heat and fire.
The 1998 movie Deep Impact is built around the premise of a similar impact occurring in modern times. The impact scene in the movie depicts how an oceanic asteroid strike would generate a tsunami that would devastate any nearby landmass. Here’s the link (it’ll open in a new tab).
6. What happens after mass extinctions?
You wouldn’t want to be around during a mass extinction. However, you are around because of a mass extinction. Here’s why.
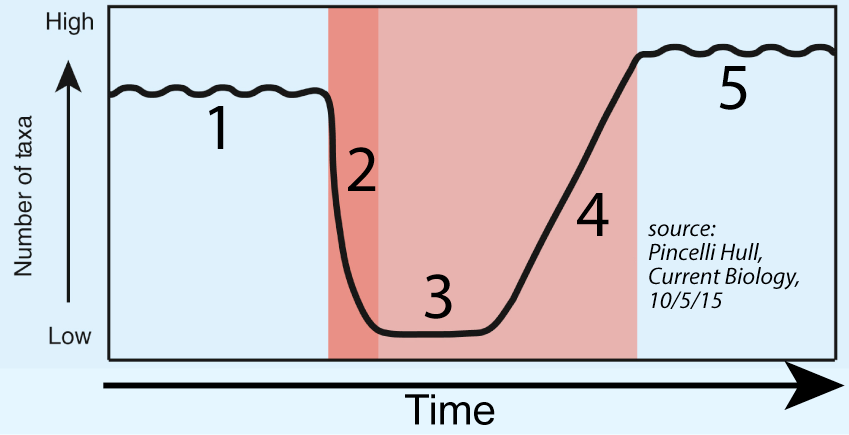
The graph to the left shows species diversity before, during, and after a mass extinction event. Number “1” shows the number of taxa before the event. At “2,” you can see diversity plummet, reaching the bottom at “3.”
After “3,” the environment begins to recover. As a result, the survivors begin to diversify into the newly empty ecological niches. The result is an amplification of species diversity (shown by the rising line at “4”), ending in a new equilibrium between speciation and the background level of distinction (at “5”).
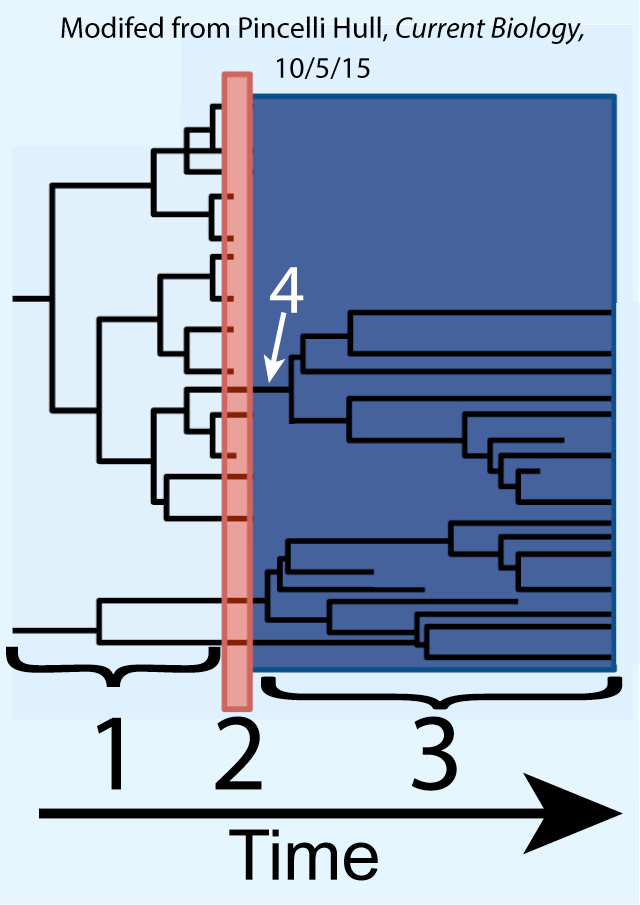
The graph to the right tells a similar story. “1” shows phylogenetic diversification leading up to a mass extinction, which occurs at “2.”
You can see how mass extinction extinguishes most lineages. But some survive, such as the lineage shown at “4.” During the subsequent eons, the survivors get to experience their own adaptive radiation, which occurs during period “3.”
Let’s apply this to the Cretaceous extinction, the one caused by the asteroid impact 65 million years ago. Among the lineages that came to an end were all the dinosaurs, as well as their marine cousins, like mosasaurs and plesiosaurs. But the mammals (which in this case would be the lineage at “4”) survived. Within a few million years, all of the modern mammal clades (for example, the whales, dogs, bears, rodents, horses, bats, and primates) came into being.
Had the dinosaurs not been wiped out, our primate clade would have never emerged. That means that apes wouldn’t have emerged, and hominids wouldn’t have emerged either. That doesn’t mean that sapient, conscious beings wouldn’t have emerged on this planet: it just means that they wouldn’t have been beings like you or me. We both owe our existence to that asteroid that wiped out the dinosaurs. Every other mammal should be similarly appreciative.
The takeaway? Mass extinctions are terrifying. But they also set the stage for new diversification of life.
7. Extinction: Flashcards
[qdeck bold_text=”false” style=”width: 600px !important; min-height: 450px !important;” qrecord_id=”sciencemusicvideosMeister1961-Extinction Flashcards (v2.0)”]
[h]Extinction Flashcards
[i]
[q] List two things that might cause a species to become extinct.
[a]Causes of extinction could include…
- Disruption of a species’ habitat (where a species lives). That can occur through a variety of ecological or geological processes that change the climate or alter the landscape.
- Some ecological disturbance that interferes with how a species survives within its ecological niche (its way of making a living). Often, this disturbance involves a new competitor, predator, or parasite.
[q] Describe what happens as a species enters an extinction vortex.
[a]As a species enters an extinction vortex
- Ecological disturbances make it difficult for a species to successfully survive in its habitat and niche. As a result, there’s a decrease in the population size.
- This lowered size leads to genetic drift and decreases genetic variability.
- Decreased variability makes the population less fit and adaptable
- Lowered fitness leads to higher mortality and a lower birth rate.
- Additional disturbances lead to further population decline.
[q] Define the term “background extinction rate” and list a widely quoted value for the background extinction rate.
[a] The background extinction rate is how often extinctions normally occur. A widely quoted value for this rate is one extinction/million species/year.
[q]Define the term “species lifespan.” What’s the species lifespan value of a mammal species (like us)?
[a]A species lifespan is how long a species can be expected to survive before becoming extinct. For mammals, this is about one million years.
[q]What’s a mass extinction? On a very general level, what causes mass extinctions?
[a]A mass extinction is a time when many species simultaneously become extinct at a rate that far exceeds the background level of extinction.
The causes of these extinctions are generally geological (massive volcanic eruptions changing the climate, or movements of continents that obliterate coastlines) or astronomical (impacts of comets or asteroids that cause massive devastation on a planetary scale).
[q]
- List the number of mass extinctions that have happened during the past 600 million years, and
- Describe two of these mass extinctions.
[a]Not including the current mass extinction, there have been 5 mass extinctions during the past 600 million years (5 that are well-documented in the fossil record).
Two of the most notable ones are “the Great Dying” (the Permian extinction) which occurred 250 million years ago, and the Cretaceous-Tertiary extinction which wiped out the dinosaurs about 65 million years ago).
[q]Interpret the graph below.
[a]
The graph is showing how biodiversity returns after a mass extinction.
- The amount of biodiversity (number of taxa) before a mass extinction
- Mass extinction
- Biodiversity after the mass extinction
- Rise in biodiversity as each surviving species undergoes adaptive radiation
- A new level of biodiversity after recovery.
[q]Interpret the graph below.
[a]This graph is showing how biodiversity returns after a mass extinction.
- The array of species existing before a mass extinction.
- Mass extinction event
- Adaptive radiation of survivors after the mass extinction.
- One of the survivors.
[/qdeck]
8. Extinction: Checking Understanding
It’s widely agreed that a sixth mass extinction is in progress and that we humans are to blame. We’ll cover that in AP Bio Unit 8 in a tutorial about human impact on biodiversity. But for now, consolidate your understanding by taking the quiz below.
[qwiz style=”width: 600px !important;” qrecord_id=”sciencemusicvideosMeister1961-Understanding Extinction (v2.0)”]
[h] Understanding Extinction
[i]
[q] Extinction happens when a species can no longer exploit its ecological [hangman]. This might be because of a change in the [hangman], or the arrival of a better-adapted [hangman].
[c]IG5pY2hl[Qq]
[f]IEdyZWF0IQ==[Qq]
[c]IGVudmlyb25tZW50[Qq]
[f]IEV4Y2VsbGVudCE=[Qq]
[c]IGNvbXBldGl0b3I=[Qq]
[f]IENvcnJlY3Qh[Qq]
[q] The positive feedback loop in which ecological disturbance lowers a population’s size to the point where it has less genetic variability and becomes less adaptable, which further lowers the population’s size is known as an [hangman] [hangman].
[c]ZXh0aW5jdGlvbg==[Qq]
[c]IHZvcnRleA==[Qq]
[q] The rate at which extinctions normally occur is called the [hangman] level of extinction.
[c]IGJhY2tncm91bmQ=[Qq]
[f]IEdvb2Qh[Qq]
[q multiple_choice=”true”] It’s estimated that _________ of the species that have ever existed are now extinct.
[c]IG92ZXIgbmluZXR5LW 5pbmUgcGVyY2VudA==[Qq]
[f]IE5pY2Ugam9iLiBPdmVyIDk5LjklIG9mIHRoZSBzcGVjaWVzIHRoYXQgaGF2ZSBldmVyIGxpdmVkIGFyZSBub3cgZXh0aW5jdC4=[Qq]
[c]IGhhbGY=[Qq]
[f]IE5vLiBJdCYjODIxNztzIG11Y2ggaGlnaGVyIHRoYW4gdGhhdC4=[Qq]
[c]IG9ubHkgYSBzbWFsbCBwZXJjZW50YWdl[Qq]
[f]IE5vLiBSZW1lbWJlciB0aGF0IGV4dGluY3Rpb24gaXMgcXVpdGUgY29tbW9uLCBhbmQgdGhhdCBsaWZlIGhhcyBiZWVuIG9uIGVhcnRoIGZvciBhIGxvbmcgdGltZS4=[Qq]
[q multiple_choice=”true”] The average lifespan of a species is closest to
[c]IGEgdGhvdXNhbmQgeWVhcnM=[Qq]
[f]IE5vLiBJdCYjODIxNztzIG11Y2ggbG9uZ2VyIHRoYW4gdGhhdC4gSnVzdCB0aGluayBvZiBvdXIgc3BlY2llcy4gUmVjb3JkZWQgaHVtYW4gaGlzdG9yeSBzdHJldGNoZXMgYmFjayBhIGZldyB0aG91c2FuZCB5ZWFycy4gV2UmIzgyMTc7dmUgYmVlbiBhcm91bmQgZm9yIG11Y2ggbG9uZ2VyIHRoYW4gdGhhdC4=[Qq]
[c]IGEgYmlsbGlvbiB5ZWFycy4=[Qq]
[f]IE5vLiBUaGF0JiM4MjE3O3Mgd2F5IHRvbyBsb25nLiBBdCB0aGF0IGxpZmVzcGFuLCBzcGVjaWVzIHdvdWxkIHJhcmVseSBiZWNvbWUgZXh0aW5jdC4=[Qq]
[c]IGEgZmV3IG1pbG xpb24geWVhcnMu[Qq]
[f]IEV4Y2VsbGVudC4gQSB0eXBpY2FsIHNwZWNpZXMgbGlmZXNwYW4gaXMgYSBmZXcgbWlsbGlvbiB5ZWFycy4=[Qq]
[q] Periods of significant, global environmental change can lead to [hangman] extinctions
[c]IG1hc3M=[Qq]
[f]IEdyZWF0IQ==[Qq]
[q multiple_choice=”true”] Which of the following statements about point “3” is correct?
[c]IEF0IHBvaW50ICYjODIyMDszLCYjODIyMTsgYWJvdXQgNTAlIG9mIHRoZSBzcGVjaWVzIG9uIGVhcnRoIGJlY2FtZSBleHRpbmN0Lg==[Qq]
[f]IE5vLiBOb3RlIHRoZSB0aXRsZSBvZiB0aGUgZ3JhcGguIFRoaXMgaXMgYWJvdXQgdGhlIGV4dGluY3Rpb24gb2YgZ2VuZXJhLCBhbmQgZWFjaCBnZW51cyBjYW4gY29udGFpbiBtdWx0aXBsZSBzcGVjaWVzLg==[Qq]
[c]IEF0IHBvaW50ICYjODIyMDszLCYjODIyMTsgb3ZlciA5MC Ugb2YgbWFyaW5lIHNwZWNpZXMgYmVjYW1lIGV4dGluY3Qu[Qq]
[f]IFdheSB0byBnby4gVGhlIDUwJSBvZiBtYXJpbmUgZ2VuZXJhIHRoYXQgYmVjYW1lIGV4dGluY3QgcmVwcmVzZW50IGFib3V0IDk2JSBvZiBtYXJpbmUg[Qq]species.
[c]IFRoZSBtYXNzIGV4dGluY3Rpb24gYXQgcG9pbnQgMyB3YXMgbGltaXRlZCB0byBtYXJpbmUgdGF4YS4gTGFuZC1saXZpbmcgc3BlY2llcyB3ZXJlIHVuYWZmZWN0ZWQu[Qq]
[f]IE5vLiBXaGlsZSB0aGUgZ3JhcGggcmVjb3JkcyB0aGUgZXh0aW5jdGlvbiBvZiBtYXJpbmUgc3BlY2llcywgdGhlcmUmIzgyMTc7cyBubyBldmlkZW5jZSBpbiB0aGUgZ3JhcGggdGhhdCBsYW5kLWxpdmluZyBzcGVjaWVzIHdlcmUgdW5hZmZlY3RlZC4gQWNjb3JkaW5nIHRvIHRoZSBmb3NzaWwgcmVjb3JkLCBhYm91dCA3MCUgb2YgdGVycmVzdHJpYWwgc3BlY2llcyBkaWVkIGluIHRoaXMgbWFzcyBleHRpbmN0aW9uLg==[Qq]
[q] In the graph below, which number indicates the mass extinction that wiped out the dinosaurs?
[textentry single_char=”true”]
[c]ID U=[Qq]
[f]IEV4Y2VsbGVudC4gVGhlIG1hc3MgZXh0aW5jdGlvbiB0aGF0IHdpcGVkIG91dCB0aGUgZGlub3NhdXJzIG9jY3VycmVkIGFib3V0IDY1IG1pbGxpb24geWVhcnMgYWdvLCBhdCBwb2ludCAmIzgyMjA7NS4mIzgyMjE7[Qq]
[c]IEVudGVyIHdvcmQ=[Qq]
[f]IE5vLg==[Qq]
[c]ICo=[Qq]
[f]IE5vLiBIZXJlJiM4MjE3O3MgYSBoaW50LiBUaGUgZXh0aW5jdGlvbiB0aGF0IHdpcGVkIG91dCB0aGUgZGlub3NhdXJzIG9jY3VycmVkIGFib3V0IDY1IG1pbGxpb24geWVhcnMgYWdvLg==[Qq]
[q] In the graph below, which number indicates the mass extinction that’s known as the “Great Dying.”
[textentry single_char=”true”]
[c]ID M=[Qq]
[f]IE5pY2UuIFRoZSBtYXNzIGV4dGluY3Rpb24ga25vd24gYXMgdGhlICYjODIyMDtHcmVhdCBEeWluZyYjODIyMTsgb2NjdXJyZWQgYWJvdXQgMjYwIG1pbGxpb24geWVhcnMgYWdvLg==[Qq]
[c]IEVudGVyIHdvcmQ=[Qq]
[f]IFNvcnJ5LCB0aGF0JiM4MjE3O3Mgbm90IGNvcnJlY3Qu[Qq]
[c]ICo=[Qq]
[f]IE5vLiBIZXJlJiM4MjE3O3MgYSBoaW50LiBUaGlzIHdhcyB0aGUgYmlnZ2VzdCBtYXNzIGV4dGluY3Rpb24u[Qq]
[q] In the graph below, which number indicates a mass extinction?”
[textentry single_char=”true”]
[c]ID I=[Qq]
[f]IEdvb2Qgd29yay4gVGhlIGxpbmUgcnVubmluZyBmcm9tIGxlZnQgdG8gcmlnaHQgb24gdGhlIGdyYXBoIGluZGljYXRlcyB0aGUgbnVtYmVyIG9mIHRheGEuIFRoZSBwbGFjZSB3aGVyZSB0aGF0IG51bWJlciBkZWNsaW5lcyBpcyB0aGUgbWFzcyBleHRpbmN0aW9uLg==[Qq]
[c]IEVudGVyIHdvcmQ=[Qq]
[f]IE5vLg==[Qq]
[c]ICo=[Qq]
[f]IE5vLiBIZXJlJiM4MjE3O3MgYSBoaW50LiBEdXJpbmcgYSBtYXNzIGV4dGluY3Rpb24sIHRoZSBudW1iZXIgb2YgdGF4YSBkZWNsaW5lcy4=[Qq]
[q] In the graph below, which number indicates adaptive radiation following a mass extinction?”
[textentry single_char=”true”]
[c]ID Q=[Qq]
[f]IEF3ZXNvbWUuIFRoZSBsaW5lIHJ1bm5pbmcgZnJvbSBsZWZ0IHRvIHJpZ2h0IG9uIHRoZSBncmFwaCBpbmRpY2F0ZXMgdGhlIG51bWJlciBvZiB0YXhhLiBUaGUgcGxhY2Ugd2hlcmUgdGhhdCBudW1iZXIgaXMgcmlzaW5nIGluZGljYXRlcyB0aGUgcmlzZSBpbiBkaXZlcnNpdHkgYXNzb2NpYXRlZCB3aXRoIHN1cnZpdmluZyBjbGFkZXMgZXZvbHZpbmcgaW50byBuZXdseSBhdmFpbGFibGUgbmljaGVzIGFmdGVyIGEgbWFzcyBleHRpbmN0aW9uLg==[Qq]
[c]IEVudGVyIHdvcmQ=[Qq]
[f]IE5vLg==[Qq]
[c]ICo=[Qq]
[f]IE5vLiBIZXJlJiM4MjE3O3MgYSBoaW50LiBMb29rIGZvciB0aGUgcGFydCBvZiB0aGUgbGluZSB3aGVyZSB0aGUgbnVtYmVyIG9mIHRheGEgaXMgcmlzaW5nLg==[Qq]
[q] The graph below indicates how following a [hangman] [hangman] (at “2”), survivors (such as the one shown at “4”) can undergo [hangman] [hangman] as their descendants diversify into the ecological space vacated by the organisms that became extinct.
[c]IG1hc3M=[Qq]
[f]IEV4Y2VsbGVudCE=[Qq]
[c]IGV4dGluY3Rpb24=[Qq]
[f]IEV4Y2VsbGVudCE=[Qq]
[c]IGFkYXB0aXZl[Qq]
[f]IENvcnJlY3Qh[Qq]
[c]IHJhZGlhdGlvbg==[Qq]
[f]IENvcnJlY3Qh[Qq]
[q] In the graph below, which number indicates a lineage that wasn’t wiped out by a mass extinction?
[textentry single_char=”true”]
[c]ID Q=[Qq]
[f]IE5pY2UuIE51bWJlciAmIzgyMjA7NCYjODIyMTsgaW5kaWNhdGVzIGEgbGluZWFnZSB0aGF0IHN1cnZpdmVkIHRoZSBtYXNzIGV4dGluY3Rpb24u[Qq]
[c]IEVudGVyIHdvcmQ=[Qq]
[f]IE5vLg==[Qq]
[c]ICo=[Qq]
[f]IE5vLiBIZXJlJiM4MjE3O3MgYSBoaW50LiBMb29rIGZvciBhIGxpbmUgdGhhdCBwYXNzZXMgdGhyb3VnaCB0aGUgbWFzcyBleHRpbmN0aW9uIChpbmRpY2F0ZWQgYnkgJiM4MjIwOzImIzgyMjE7KS4=[Qq]
[q] In the graph below, which number indicates a mass extinction?
[textentry single_char=”true”]
[c]ID I=[Qq]
[f]IEdvb2Qgd29yay4gTnVtYmVyICYjODIyMDsyJiM4MjIxOyBpbmRpY2F0ZXMgYSBtYXNzIGV4dGluY3Rpb24u[Qq]
[c]IEVudGVyIHdvcmQ=[Qq]
[f]IFNvcnJ5LCB0aGF0JiM4MjE3O3Mgbm90IGNvcnJlY3Qu[Qq]
[c]ICo=[Qq]
[f]IE5vLiBIZXJlJiM4MjE3O3MgYSBoaW50LiBMb29rIGZvciBhIG1vbWVudCB3aGVuIG1hbnkgb2YgdGhlIGxpbmVhZ2VzIGF0ICYjODIyMDsxJiM4MjIxOyBjZWFzZSB0byBleGlzdC4gWW91IGNhbiB0ZWxsIHRoZXkgY2Vhc2UgdG8gZXhpc3QgYmVjYXVzZSB0aGUgbGluZSBlbmRzLg==[Qq]
[q] In the graph below, which number indicates an adaptive radiation that follows a mass extinction?
[textentry single_char=”true”]
[c]ID M=[Qq]
[f]IEdvb2Qgam9iLiBOdW1iZXIgJiM4MjIwOzMmIzgyMjE7IGluZGljYXRlcyBhZGFwdGl2ZSByYWRpYXRpb24gYW5kIGJpb2xvZ2ljYWwgZGl2ZXJzaWZpY2F0aW9uIGZvbGxvd2luZyBhIG1hc3MgZXh0aW5jdGlvbi4=[Qq]
[c]IEVudGVyIHdvcmQ=[Qq]
[f]IE5vLCB0aGF0JiM4MjE3O3Mgbm90IGNvcnJlY3Qu[Qq]
[c]ICo=[Qq]
[f]IE5vLiBIZXJlJiM4MjE3O3MgYSBoaW50LiBMb29rIGZvciBhIG1vbWVudCBpbiB0aW1lIHdoZW4gbWFueSBuZXcgbGluZWFnZXMgZW1lcmdlLg==[Qq]
[/qwiz]
What’s Next?
Proceed to our Speciation and Extinction: Cumulative Flashcards and Quiz.