1. Understanding Diabetes
Diabetes is a disease in which people can’t regulate their blood glucose levels. Immediate symptoms are frequent urination, thirst, and hunger. Untreated, diabetes can be fatal: before it kills, diabetes can lead to cardiovascular diseases such as heart attacks and strokes; kidney disease; ulcers of the feet; and damage to the eyes (just to name some of the long-term effects: you can learn more at the website of the Diabetes Foundation)
There are two forms, Type 1 (which generally occurs in children) and Type 2 (which generally occurs in adults).
2. Type 1 Diabetes
Type 1 diabetes is an autoimmune disorder that usually sets in during childhood, but can happen later in life, too. “Autoimmune” means that the immune system, the function of which is to protect us from disease-causing agents like bacteria, viruses, and even cancer cells, attacks our own healthy tissues. Other autoimmune conditions include lupus, rheumatoid arthritis, and multiple sclerosis. You can learn more about autoimmune disorders here.
Because of its early onset, Type 1 diabetes is also referred to as juvenile diabetes.
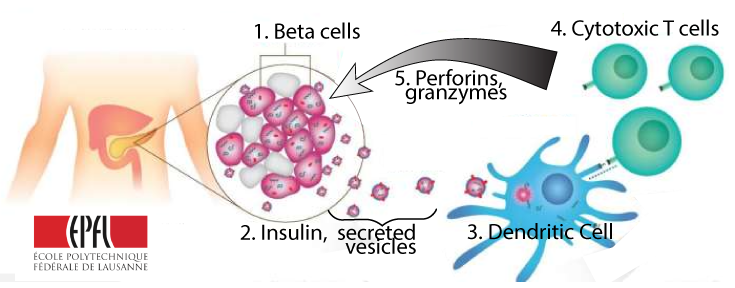
In children with type 1 diabetes, beta cells (1) and their secretions (insulin and secreted vesicles, shown at “2”) are mistakenly seen as outside invaders by the cells of the immune system. These immune system cells are labeled above as “dendritic cells (3)” and “cytotoxic T cells (4).” In response, the cytotoxic T cells unleash the weapons of the immune response. Primary among these weapons are molecules called granzymes and perforins that attach to and destroy the pancreatic Beta cells (“5”). Without Beta cells, a person can no longer produce insulin, so blood glucose homeostasis becomes impossible.
Type 1 diabetes accounts for 5 to 10% of diabetes, and it affects about 1.25 million Americans. It can be treated by ongoing injections of insulin, attention to diet, and careful monitoring of blood glucose levels.
The use of insulin to treat diabetes was first discovered in 1921. Between 1921 and about 1980, this insulin had to be extracted from other mammals, like cows, sheep, and pigs. Starting in the 1980s, insulin has been genetically engineered (something we’ll learn about in AP Bio Unit 6).
3. Type 2 Diabetes
Type 2 diabetes is far more common than type 1. In type 2 diabetes, insulin levels can be normal, but liver cells, fat cells, and muscle cells don’t respond to insulin, a condition known as insulin resistance.
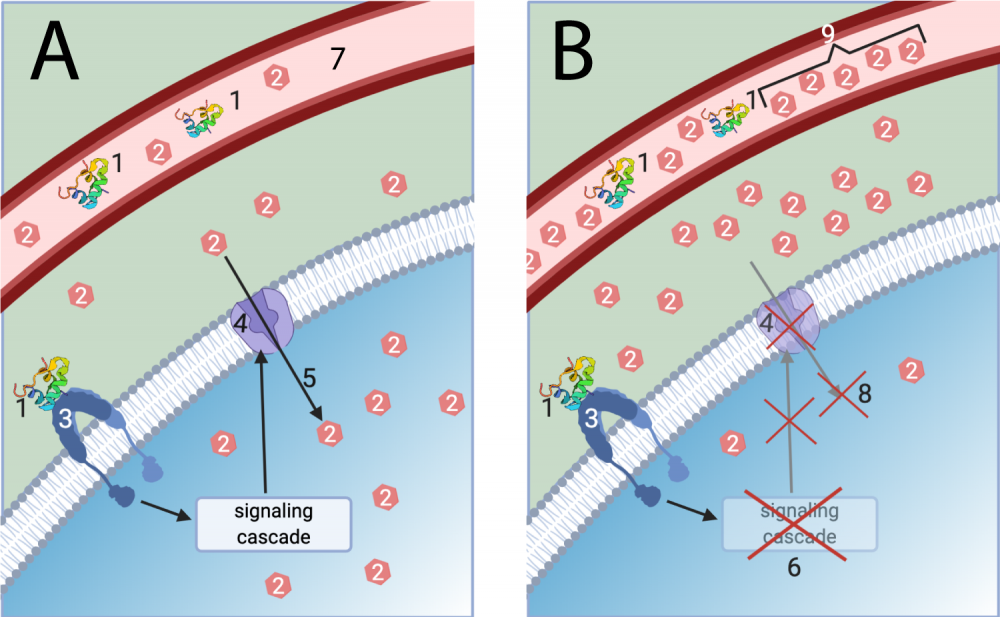
The diagram above contrasts normal insulin-induced glucose regulation (“A”) with the insulin resistance (“B”) that happens in type 2 diabetes.
In normal glucose regulation, insulin (1) binds with an insulin receptor (3) in liver and muscle cells. This induces a signaling cascade that mobilizes glucose channels (4) to move to the cell membranes of these cells. These channels allow glucose (2) to enter the cells by facilitated diffusion (5). Notice the high level of glucose inside the cell, and the low level of glucose in the bloodstream (7).
In type 2 diabetes, cells don’t respond to the insulin signal. This is represented at 6 (malfunctioning of the signaling cascade) and 8 (glucose not diffusing through the absent glucose transport channel). As a result of glucose not being taken up by the cells, glucose builds up in the bloodstream (9).
Because blood levels of glucose remain high in type 2 diabetes, Beta cells continue to receive the signal that they need to produce insulin. This continual stimulation can lead Beta cells to fail. As a result, some type 2 diabetics may require insulin injections as part of their treatment.
Because of lifestyle factors — increasing levels of obesity and decreasing levels of physical activity — Up to 30 million Americans (10% of the population) have type 2 diabetes. Up to 100 million American adults have a condition called prediabetes (source: (healthline.com). Prediabetes involves elevated blood sugar levels, but not at a level high enough to be classified as diabetes. However, some of the organ/tissue damage associated with diabetes may have already begun. Type 2 diabetes has risen to become the 7th most common cause of death in the U.S.
4. Type 1 and Type 2 Diabetes: Checking Understanding
[qwiz qrecord_id=”sciencemusicvideosMeister1961-Type 1 and Type 2 Diabetes (v2.0)”]
[h]Type 1 and Type 2 Diabetes: Checking Understanding
[i]
[q]Whereas Type 1 diabetes generally occurs in [hangman], Type 2 diabetes is generally a disease of [hangman].
[c]Y2hpbGRyZW4=[Qq]
[c]YWR1bHRz[Qq]
[q] The diagram below is showing the origin of type ___ diabetes.
[textentry single_char=”true”]
[c]ID E=[Qq]
[f]IEdvb2QhIFRoZSBkaWFncmFtIGFib3ZlIGlzIHNob3dpbmcgdGhlIG9yaWdpbiBvZiB0eXBlIDEgZGlhYmV0ZXMu[Qq]
[c]IEVudGVyIHdvcmQ=[Qq]
[f]IFNvcnJ5LCB0aGF0JiM4MjE3O3Mgbm90IGNvcnJlY3Qu[Qq]
[c]ICo=[Qq]
[f]IE5vLCBidXQgaGVyZSYjODIxNztzIGEgaGludDogd2hpY2ggdHlwZSBvZiBkaWFiZXRlcyBpcyBjYXVzZWQgYnkgYW4gYXV0b2ltbXVuZSByZWFjdGlvbiB0aGF0IGRlc3Ryb3lzIHRoZSBCZXRhIGNlbGxzIGluIHRoZSBwYW5jcmVhcz8=[Qq]
[q] The diagram below shows how Type 1 Diabetes is a(n) [hangman] disorder that destroys the [hangman] cells in the pancreas. As a result, people with Type 1 diabetes can no longer produce [hangman].
[c]YXV0b2ltbXVuZQ==[Qq]
[c]YmV0YQ==[Qq]
[c]aW5zdWxpbg==[Qq]
[q] In the diagram below, the cytotoxic or killer T cells that destroy a person’s Beta cells are shown at
[textentry single_char=”true”]
[c]IE U=[Qq]
[f]IEV4Y2VsbGVudCEgSW4gdGhlIGRpYWdyYW0gYWJvdmUsIHRoZSBsZXR0ZXIgJiM4MjIwO0UmIzgyMjE7IGluZGljYXRlcyBhIGN5dG90b3hpYyBvciBraWxsZXIgVCBjZWxsLg==[Qq]
[c]IEVudGVyIHdvcmQ=[Qq]
[f]IFNvcnJ5LCB0aGF0JiM4MjE3O3Mgbm90IGNvcnJlY3Qu[Qq]
[c]ICo=[Qq]
[f]IE5vLCBidXQgaGVyZSYjODIxNztzIGEgaGludC4gVGhlIGN5dG90b3hpYyBvciBraWxsZXIgVCBjZWxscyByZWxlYXNlIGNoZW1pY2FsIHdlYXBvbnMgdGhhdCBkZXN0cm95IHRoZSBiZXRhIGNlbGxzIGluIHRoZSBwYW5jcmVhcy4gV2hpY2ggY2VsbHMgKGJhc2VkIG9uIHRoZSBmbG93IG9mIGFycm93cykgc2VlbSB0byBiZSBvbiB0aGUgYXR0YWNrPw==[Qq]
[q] The diagram below shows how in type 2 diabetes, cells stop responding to [hangman]. As a result, [hangman] (at “2”) won’t [hangman] through membrane channels (shown at “4”). As a result, the concentration of glucose in the [hangman] rises to high levels.
[c]IGluc3VsaW4=[Qq]
[f]IEdyZWF0IQ==[Qq]
[c]IGdsdWNvc2U=[Qq]
[f]IENvcnJlY3Qh[Qq]
[c]IGRpZmZ1c2U=[Qq]
[f]IEV4Y2VsbGVudCE=[Qq]
[c]IGJsb29k[Qq]
[f]IEdyZWF0IQ==[Qq]
[q] In the diagram below, the glucose transporter is shown at
[textentry single_char=”true”]
[c]ID Q=[Qq]
[f]IEV4Y2VsbGVudCEgSW4gdGhlIGRpYWdyYW0gYWJvdmUsICYjODIyMDs0JiM4MjIxOyBpcyB0aGUgZ2x1Y29zZSB0cmFuc3BvcnRlci4=[Qq]
[c]IEVudGVyIHdvcmQ=[Qq]
[f]IFNvcnJ5LCB0aGF0JiM4MjE3O3Mgbm90IGNvcnJlY3Qu[Qq]
[c]ICo=[Qq]
[f]IE5vLCBidXQgaGVyZSYjODIxNztzIGEgaGludC4gJiM4MjIwOzImIzgyMjE7IGlzIGdsdWNvc2UuIEhvdyBpcyBpdCBlbnRlcmluZyB0aGUgY2VsbHMgaW4gYSBwZXJzb24gd2l0aG91dCBUeXBlIDIgZGlhYmV0ZXM/[Qq]
[q] In the diagram below, insulin is represented by
[textentry single_char=”true”]
[c]ID E=[Qq]
[f]IE5pY2Ugam9iISBJbiB0aGUgZGlhZ3JhbSBhYm92ZSwgJiM4MjIwOzEmIzgyMjE7IHJlcHJlc2VudHMgaW5zdWxpbi4=[Qq]
[c]IEVudGVyIHdvcmQ=[Qq]
[f]IFNvcnJ5LCB0aGF0JiM4MjE3O3Mgbm90IGNvcnJlY3Qu[Qq]
[c]ICo=[Qq]
[f]IE5vLCBidXQgaGVyZSBhcmUgYSBmZXcgaGludHMuIEZpcnN0LCBpbnN1bGluIGlzIGEgcHJvdGVpbiB0aGF0IGNhbiBiZSBmb3VuZCBpbiB0aGUgYmxvb2RzdHJlYW0uIFNlY29uZCwgaW5zdWxpbiBiaW5kcyB3aXRoIGEgbWVtYnJhbmUgcmVjZXB0b3IgYnV0IGRvZXNuJiM4MjE3O3QgZW50ZXIgdGhlIGNlbGwu[Qq]
[q] In the diagram below, normal blood glucose levels are represented by number
[textentry single_char=”true”]
[c]ID c=[Qq]
[f]IEF3ZXNvbWUhIEluIHRoZSBkaWFncmFtIGFib3ZlLCAmIzgyMjA7NyYjODIyMTsgcmVwcmVzZW50cyBub3JtYWwgYmxvb2QgZ2x1Y29zZSBsZXZlbHMu[Qq]
[c]IEVudGVyIHdvcmQ=[Qq]
[f]IFNvcnJ5LCB0aGF0JiM4MjE3O3Mgbm90IGNvcnJlY3Qu[Qq]
[c]ICo=[Qq]
[f]IE5vLCBidXQgaGVyZSYjODIxNztzIGEgaGludC4gJiM4MjIwOzImIzgyMjE7IGlzIGdsdWNvc2UuIFdoZXJlIGRvIHlvdSBzZWUganVzdCBhIGZldyBnbHVjb3NlIG1vbGVjdWxlcyBpbiB0aGUgYmxvb2RzdHJlYW0/[Qq]
[q]People with elevated blood glucose levels (but no other symptoms) have a condition that’s called [hangman].
[c]cHJlZGlhYmV0ZXM=[Qq]
[x][restart]
[/qwiz]
5. Diabetes Symptoms: Why sweet, excessive urine, and excessive thirst?
The formal medical name for diabetes is Diabetes mellitus. The diabetes part comes from the Greek word for siphon and refers to urine. The mellitus part comes from the Latin word for “honey.” That’s because an early diagnostic test for juvenile diabetes involved tasting the urine of babies and toddlers who were constantly thirsty and peeing all of the time.
Why is the urine of diabetics sweet? And why is one of the first diagnostic signs of both type 1 and type 2 diabetes excessive thirst and frequent urination? Let’s look at the underlying biology behind why that is. I’ve put in two versions of the diagram below to make it easy to consult the diagram as you read.
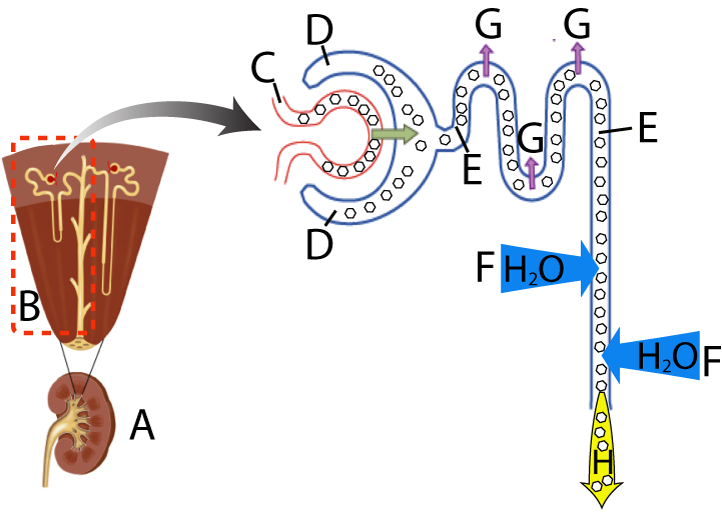
The kidneys (one of which is shown in cross-section at “A”) are the main organ responsible for controlling the osmolarity of our body fluids. The kidneys do that by filtering the blood through millions of tubules called nephrons (B). After filtration, these tubules process the filtrate (the filtered liquid), reabsorb needed substances (like glucose and salts), and excrete harmful wastes (like urea).
Blood enters your kidneys through a major blood vessel called the renal artery (not shown). This artery divides again and again until it has millions of branches, each of which ends in a bed of thin-walled capillaries that form a structure called the glomerulus (shown in a simplified form at “C”). The glomerulus is the filter in the system. It holds back the large components of the blood (red and white blood cells, platelets, and large proteins) within the blood vessels. But smaller components of blood — solutes like sugar and salt, other small molecules, and waste) — pass through the glomerulus and enter a capsule (at “D”). You can think of this as being similar to pouring water through a coffee filter. The filter holds in the coffee grounds and lets the dissolved coffee and most of the water through. What passes through the glomerulus is called filtrate. To continue the analogy, when you’re drinking coffee, you’re drinking filtrate.
After the capsule (D), the filtrate winds its way through the nephron tubule (at “E”) Specialized cells in the walls of the tubule reabsorb valuable materials, such as glucose, and return them to the blood. In this diagram, reabsorption is represented by the upward arrows at the letter “G”. Whatever isn’t reabsorbed from the filtrate in the tubule winds up being excreted, with waste products, in the urine (“H”).
In non-diabetics, all of the glucose in the filtrate will be reabsorbed from the tubule, and the urine will be free of glucose. However, in diabetics, the level of blood glucose is so high that high levels of glucose also wind up being in the filtrate in the tubule. The level of glucose in the tubule exceeds the capacity of the tubule to reabsorb that glucose into the blood. As a result, glucose stays in the filtrate in the tubule, and diabetics wind up with sweet urine.
Because of their glucose-rich urine (and the glucose-rich fluid in the nephron tubule), people with untreated diabetes also lose their ability to effectively regulate the water composition of their body fluids. Regulating water concentration is called osmoregulation, and here’s why osmoregulation falters in diabetics. The glucose concentration in the nephron tubule creates a filtrate that is hypertonic to the fluid outside the tubule. Because of that, water outside the tubule flows into the tubule (shown by the arrows at “F”). The flow of water into the tubule makes for an abnormally high urine volume. And because of so much water loss, people with untreated diabetes suffer from thirst.
6. Diabetes (and related topics): Checking Understanding
[qwiz qrecord_id=”sciencemusicvideosMeister1961-Diabetes and Blood Glucose Regulation (v2.0)”] [h]
Diabetes and Blood Glucose Regulation: Cumulative Quiz
[i]
[q] The hormone that’s causing the drop in blood glucose between points “B” and “C” is [hangman].
[c]IGluc3VsaW4=[Qq]
[f]IEdvb2Qh[Qq]
[q] The hormone that’s causing the rise in blood glucose levels between points “C” and “D” is [hangman].
[c]IGdsdWNhZ29u[Qq]
[f]IENvcnJlY3Qh[Qq]
[q] The pancreatic cells that release insulin are the [hangman]cells. The cells that release glucagon are the [hangman].
[c]IEJldGE=[Qq]
[f]IEdyZWF0IQ==[Qq]
[c]IGFscGhh[Qq]
[f]IENvcnJlY3Qh[Qq]
[q] Glucagon induces cells in the liver and muscle to take the polysaccharide [hangman] and to convert it into the monosaccharide [hangman], which can then diffuse out of these cells and enter the [hangman].
[c]IGdseWNvZ2Vu[Qq]
[f]IEdvb2Qh[Qq]
[c]IGdsdWNvc2U=[Qq]
[f]IENvcnJlY3Qh[Qq]
[c]IGJsb29k[Qq]
[f]IEdyZWF0IQ==[Qq]
[q] The diagram below shows how the release of the hormone [hangman] is induced by the uptake of [hangman] into Beta cells. The ATP-creating metabolic reaction shown at number 2 is [hangman] [hangman]. The ATP creates changes in the membrane that allow [hangman] ions (at “7”) to flow into the Beta cells, causing [hangman] (shown at “9”) to release this hormone into the bloodstream.
[c]IGluc3VsaW4=[Qq]
[f]IEdvb2Qh[Qq]
[c]IGdsdWNvc2U=[Qq]
[f]IENvcnJlY3Qh[Qq]
[c]IGNlbGx1bGFy[Qq]
[f]IENvcnJlY3Qh[Qq]
[c]IHJlc3BpcmF0aW9u[Qq]
[f]IENvcnJlY3Qh[Qq]
[c]IGNhbGNpdW0=[Qq]
[f]IEdvb2Qh[Qq]
[c]IGV4b2N5dG9zaXM=[Qq]
[f]IEdvb2Qh[Qq]
[q] The diagram below shows how when [hangman] (at “a”) binds with its receptor, a signal [hangman] cascade results. One effect of this cascade is to allow [hangman] to enter cells by [hangman] diffusion. Once inside the cells, some of the glucose is converted to [hangman], shown at “g.” Other glucose molecules enter [hangman] (indicated by the arrow at “h”), the products of which can get converted to [hangman] acids (at “j”).
[c]IGluc3VsaW4=[Qq]
[f]IEdvb2Qh[Qq]
[c]IHRyYW5zZHVjdGlvbg==[Qq]
[f]IEdvb2Qh[Qq]
[c]IGdsdWNvc2U=[Qq]
[f]IEdyZWF0IQ==[Qq]
[c]IGZhY2lsaXRhdGVk[Qq]
[f]IENvcnJlY3Qh[Qq]
[c]IGdseWNvZ2Vu[Qq]
[f]IEdyZWF0IQ==[Qq]
[c]IGdseWNvbHlzaXM=[Qq]
[f]IEV4Y2VsbGVudCE=[Qq]
[c]IGZhdHR5[Qq]
[f]IEdyZWF0IQ==[Qq]
[q] The diagram below shows how [hangman] at “a,” by binding with a G-coupled protein [hangman] can result in the release of the [hangman] [hangman] cAMP. cAMP, in turn, can unleash a [hangman] cascade (shown at “g”). Finally, the activation of the enzyme phosphorylase a can result in the conversion of [hangman] to [hangman], which then [hangman] out of the cell and into the bloodstream.
[c]IGdsdWNhZ29u[Qq]
[f]IENvcnJlY3Qh[Qq]
[c]IHJlY2VwdG9y[Qq]
[f]IEdvb2Qh[Qq]
[c]IHNlY29uZA==[Qq]
[f]IEV4Y2VsbGVudCE=[Qq]
[c]IG1lc3Nlbmdlcg==[Qq]
[f]IEV4Y2VsbGVudCE=[Qq]
[c]IHBob3NwaG9yeWxhdGlvbg==[Qq]
[f]IEdyZWF0IQ==[Qq]
[c]IGdseWNvZ2Vu[Qq]
[f]IEdvb2Qh[Qq]
[c]IGdsdWNvc2U=[Qq]
[f]IENvcnJlY3Qh[Qq]
[c]IGRpZmZ1c2Vz[Qq]
[f]IEV4Y2VsbGVudCE=[Qq]
[q] The diagram below shows how [hangman] (at “D”) released by the [hangman] cells of the pancreas, acts to [hangman] blood glucose concentration, returning it to the homeostatic [hangman] points. By contrast, the role of [hangman] (at “J”) is to [hangman] blood glucose levels by getting the liver to convert [hangman] to glucose.
[c]IGluc3VsaW4=[Qq]
[f]IEdyZWF0IQ==[Qq]
[c]IGJldGE=[Qq]
[f]IEdvb2Qh[Qq]
[c]IGxvd2Vy[Qq]
[f]IEdyZWF0IQ==[Qq]
[c]IHNldA==[Qq]
[f]IEdvb2Qh[Qq]
[c]IGdsdWNhZ29u[Qq]
[f]IEdvb2Qh[Qq]
[c]IGluY3JlYXNl[Qq]
[f]IEdvb2Qh[Qq]
[c]IGdseWNvZ2Vu[Qq]
[f]IEdyZWF0IQ==[Qq]
[q] In the diagram below, which patient is most likely a diabetic?
[textentry single_char=”true”]
[c]IE M=[Qq]
[f]IE5pY2Ugam9iISBQYXRpZW50IEMmIzgyMTc7cyBibG9vZCBnbHVjb3NlIGxldmVsIGlzIHdheSBhYm92ZSB0aGUgaGVhbHRoeSBzZXQgcG9pbnQgYW5kIHRoZW4gc3RheXMgaGlnaCBldmVuIGhvdXJzIGFmdGVyIGVhdGluZy4=[Qq]
[c]IEVudGVyIHdvcmQ=[Qq]
[f]IFNvcnJ5LCB0aGF0JiM4MjE3O3Mgbm90IGNvcnJlY3Qu[Qq]
[c]ICo=[Qq]
[f]IE5vLiBIZXJlJiM4MjE3O3MgYSBoaW50LiBEaWFiZXRlcyBpcyBhbiBpbmFiaWxpdHkgdG8gY29udHJvbCBibG9vZCBzdWdhciBsZXZlbHMuIE9mIHRoZSB0aHJlZSBwYXRpZW50cywgd2hvJiM4MjE3O3MgYmxvb2Qgc3VnYXIgc2VlbXMgdG8gYmUgdGhlIG1vc3Qgb3V0IG9mIGNvbnRyb2w/[Qq]
[q] In the diagram below, which patient is most likely a prediabetic?
[textentry single_char=”true”]
[c]IE I=[Qq]
[f]IEV4Y2VsbGVudCEgUGF0aWVudCBCJiM4MjE3O3MgYmxvb2QgZ2x1Y29zZSBsZXZlbHMgYXJlIGFib3ZlIGhlYWx0aHkgbGV2ZWxzLCBidXQgbm90IHlldCBhcyBvdXQgb2YgY29udHJvbCBhcyB0aGUgZGlhYmV0aWMgcGF0aWVudCAoQyku[Qq]
[c]IEVudGVyIHdvcmQ=[Qq]
[f]IFNvcnJ5LCB0aGF0JiM4MjE3O3Mgbm90IGNvcnJlY3Qu[Qq]
[c]ICo=[Qq]
[f]IE5vLiBIZXJlJiM4MjE3O3MgYSBoaW50LiBQcmVkaWFiZXRlcyBpbnZvbHZlcyBhbiBpbmFiaWxpdHkgdG8gcmVndWxhdGUgYmxvb2Qgc3VnYXIsIGJ1dCBub3QgcXVpdGUgdG8gdGhlIGV4dGVudCBhcyBpcyBmb3VuZCBpbiBkaWFiZXRpY3Mu[Qq]
[q] In the diagram below, which hormone is glucagon?
[textentry single_char=”true”]
[c]IE E=[Qq]
[f]IE5pY2Ugam9iISBIb3Jtb25lIEEgZ29lcyB1cCB3aGVuIGJsb29kIGdsdWNvc2UgbGV2ZWxzIGdvIGRvd247IGV4YWN0bHkgd2hhdCB5b3UmIzgyMTc7ZCBleHBlY3QgZm9yIGdsdWNhZ29uLg==[Qq]
[c]IEVudGVyIHdvcmQ=[Qq]
[f]IFNvcnJ5LCB0aGF0JiM4MjE3O3Mgbm90IGNvcnJlY3Qu[Qq]
[c]ICo=[Qq]
[f]IE5vLiBIZXJlJiM4MjE3O3MgYSBoaW50LiBHbHVjYWdvbiByYWlzZXMgYmxvb2QgZ2x1Y29zZSBsZXZlbHMuIExvb2sgZm9yIHRoZSBob3Jtb25lIHRoYXQgZ29lcyB1cCBpbiBjb25jZW50cmF0aW9uIHdoZW4gZ2x1Y29zZSBsZXZlbHMgZ28gZG93bi4=[Qq]
[q] In the diagram below, which hormone is insulin?
[textentry single_char=”true”]
[c]IE I=[Qq]
[f]IEV4Y2VsbGVudCEgSG9ybW9uZSBCIGdvZXMgdXAgd2hlbiBibG9vZCBnbHVjb3NlIGxldmVscyBnbyB1cDsgZXhhY3RseSB3aGF0IHlvdSYjODIxNztkIGV4cGVjdCBmb3IgaW5zdWxpbi4=[Qq]
[c]IEVudGVyIHdvcmQ=[Qq]
[f]IFNvcnJ5LCB0aGF0JiM4MjE3O3Mgbm90IGNvcnJlY3Qu[Qq]
[c]ICo=[Qq]
[f]IE5vLiBIZXJlJiM4MjE3O3MgYSBoaW50LiBJbnN1bGluIGxvd2VycyBibG9vZCBnbHVjb3NlIGxldmVscy4gTG9vayBmb3IgdGhlIGhvcm1vbmUgdGhhdCBnb2VzIHVwIGluIGNvbmNlbnRyYXRpb24gd2hlbiBnbHVjb3NlIGxldmVscyBnbyB1cC4=[Qq]
[q] The diagram below is showing how excess [hangman] in the blood (at “C”) results in [hangman] being excreted into the nephron tubule at levels that can’t be reabsorbed. As a result, [hangman] flows by [hangman] into the nephron tubule, resulting in the high level of[hangman] (letter “H”) production that’s a characteristic sign of [hangman]
[c]IGdsdWNvc2U=[Qq]
[f]IEV4Y2VsbGVudCE=[Qq]
[c]IGdsdWNvc2U=[Qq]
[f]IEdvb2Qh[Qq]
[c]IHdhdGVy[Qq]
[f]IEV4Y2VsbGVudCE=[Qq]
[c]IG9zbW9zaXM=[Qq]
[f]IEdvb2Qh[Qq]
[c]IHVyaW5l[Qq]
[f]IENvcnJlY3Qh[Qq]
[c]IGRpYWJldGVz[Qq]
[f]IENvcnJlY3Qh[Qq]
[q] In the diagram below, a capillary is indicated by the letter
[textentry single_char=”true”]
[c]IE M=
[f]IE5pY2UhICYjODIyMDtDJiM4MjIxOyBpcyBhIGNhcGlsbGFyeSBicmluZ2luZyBibG9vZCB0byBhIG5lcGhyb24gdHVidWxlLg==[Qq]
[c]IEVudGVyIHdvcmQ=[Qq]
[c]ICo=[Qq]
[f]IE5vLiBIZXJlJiM4MjE3O3MgYSBoaW50LiBUaGUgY2FwaWxsYXJpZXMgYnJpbmcgZmx1aWQgdG8gdGhlIHR1YnVsZS4gV2hhdCBzZWVtcyB0byBiZSBicmluZ2luZyBmbHVpZCA=aW50bw==IHRoaXMgc3lzdGVtPw==[Qq]
[q] In the diagram below, reabsorption of glucose (a process that happens poorly in diabetics) is indicated by the letter
[textentry single_char=”true”]
[c]IE c=
[f]IENvcnJlY3QhICYjODIyMDtHJiM4MjIxOyBzaG93cyB3aGVyZSB0aGUgdHVidWxlIGlzIHJlYWJzb3JiaW5nIGdsdWNvc2UuIFRoZSBwcm9ibGVtIHRoYXQgZGlhYmV0aWNzIGhhdmUgaXMgdGhhdCBzbyBtdWNoIGdsdWNvc2UgZ2V0cyBpbnRvIHRoZSB0dWJ1bGUgdGhhdCBpdCBleGNlZWRzIHRoZSBjYXBhY2l0eSBvZiB0aGUgdHVidWxlIHRvIHJlYWJzb3JiIGl0LCBjcmVhdGluZyB0aGUgc3VnYXJ5IHVyaW5lIGZvciB3aGljaCA=ZGlhYmV0ZXMgbWVsbGl0dXM=IGlzIG5hbWVkLg==[Qq]
[c]IEVudGVyIHdvcmQ=[Qq]
[c]ICo=[Qq]
[f]IE5vLiBIZXJlJiM4MjE3O3MgYSBoaW50LiBSZWFic29ycHRpb24gaW52b2x2ZXMgdGFraW5nIHNvbHV0ZXMgb3V0IG9mIHRoZSB0dWJ1bGUgYW5kIHJldHVybmluZyB0aGVtIHRvIHRoZSBibG9vZC4gRmluZCB0aGUgdHVidWxlLCB0aGVuIGZpbmQgYW4gYXJyb3cgaW5kaWNhdGluZyBzdWJzdGFuY2VzIA==bGVhdmluZw==IHRoZSB0dWJ1bGUu[Qq]
[q] In the diagram below, the filtrate leaving the tubule is indicated by the letter
[textentry single_char=”true”]
[c]IE g=
[f]IEdyZWF0IGpvYiEgJiM4MjIwO0gmIzgyMjE7IGluZGljYXRlcyB0aGUgZmx1aWQgdGhhdCYjODIxNztzIGxlYXZpbmcgdGhlIHR1YnVsZSwgd2hpY2ggd2UgcmVmZXIgdG8gYXMgdXJpbmUu[Qq]
[c]IEVudGVyIHRoZSB3b3Jk[Qq]
[c]ICo=[Qq]
[f]IE5vLiBIZXJlJiM4MjE3O3MgYSBoaW50LiBUaGluayBhYm91dCB0aGUgbGlxdWlkIHRoYXQgeW91ciBraWRuZXlzIG1ha2UuIFdoYXQgY29sb3IgaXMgdGhhdCBsaXF1aWQ/[Qq]
[q] As indicated by the letter “F,” diabetics also suffer from an inability to properly regulate the composition of their body fluids, a process referred to as [hangman].
[c]b3Ntb3JlZ3VsYXRpb24=[Qq]
[x][restart]
[/qwiz]
7. What’s next?
- This tutorial ends Topic 4.4, Feedback and Homeostasis.
- For another example of Feedback and Homeostasis, you can learn about ADH and Osmoregulation. Note that this tutorial is not part of our AP Biology V2.0 curriculum, so check with your teacher first.
- Return to the Unit 4 Main Menu so that you can go to the next topics in AP Bio Unit 4: Topics 4.5 and 4.6, The Cell Cycle and Cell Cycle Regulation