Here are a few more genetic patterns and phenomena to know about. Note that the College Board’s 2025 Course and Exam Description for AP Biology added “pleiotropy” to the topics covered below. We’ll be adding this during the 2025-26 school year.
1. Mitochondrial and Chloroplast Inheritance
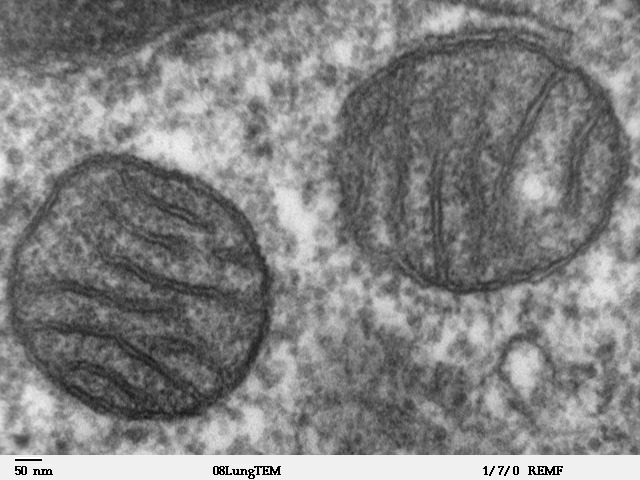
All of the genetic inheritance patterns we’ve learned about so far are the result of the inheritance of genes residing on chromosomes found in the nucleus. These genes are known as nuclear genes, and they make up the vast majority of genes.
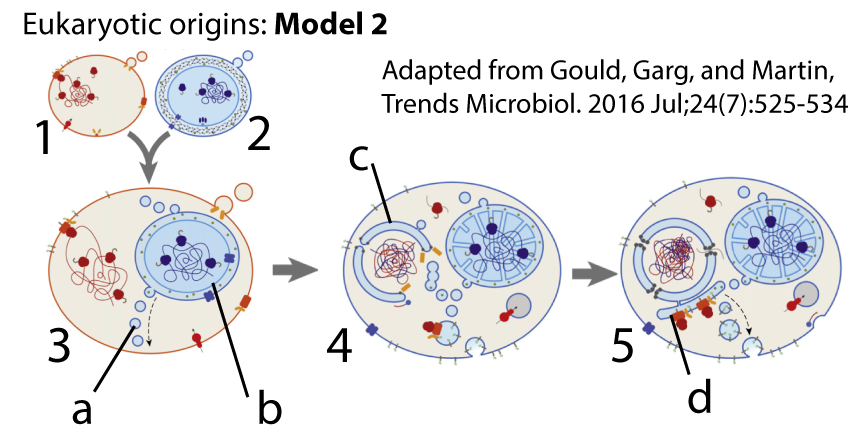
However, in all eukaryotes, there’s one organelle — the mitochondrion — that contains its own genes. That’s because mitochondria are endosymbionts. Though our mitochondria are completely dependent upon us, they are, essentially, cells that live inside our cells. According to the endosymbiotic theory, mitochondria were once independent bacterial cells that took up residence inside what was probably an archaeal cell. In the partnership that ensued, the mitochondria found a home and a supply of food. The archaeal host — which evolved into the entire domain of eukaryotes, including us — found an abundant way to make ATP. Over the last 1.8 billion years of endosymbiotic partnership, many mitochondrial genes have migrated into chromosomes within the nucleus. But every mitochondrion still contains dozens of copies of its own DNA genome: a loop of DNA consisting of 16,569 base pairs coding for 37 genes (source: Nature Scitable).
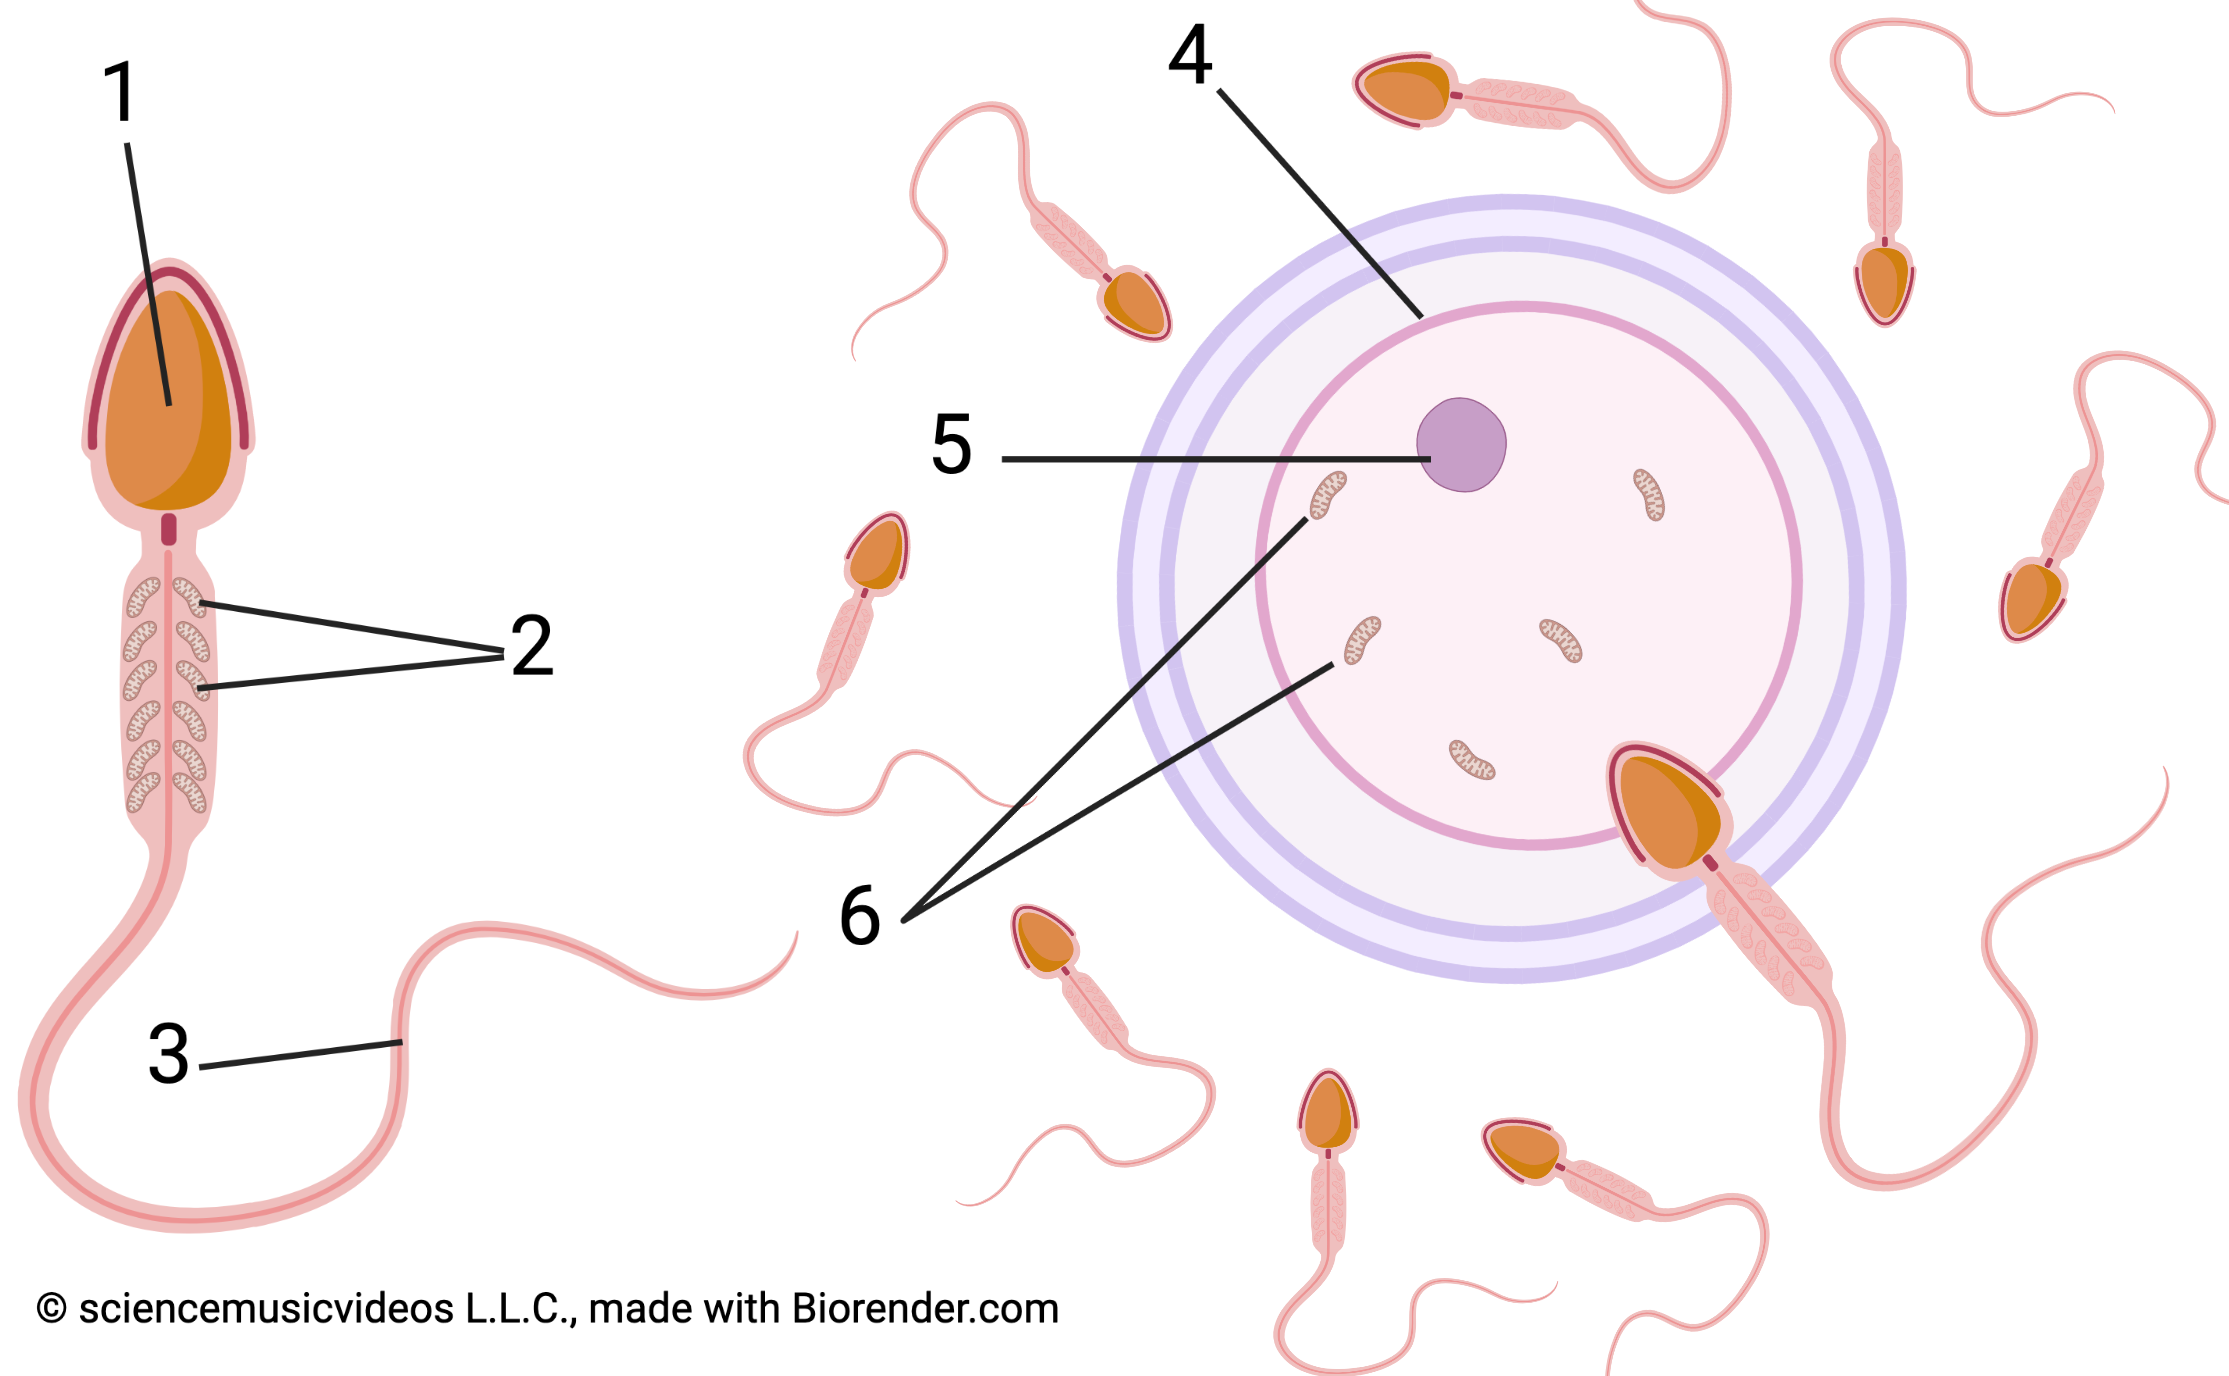
Mitochondrial genes are inherited solely through the mother. Why? It’s about what happens during fertilization. Sperm cells do contain mitochondria: They’re shown at 2, on the left where they’re function is to provide ATP to the flagellum, allowing the sperm to swim. However, none of the sperm’s mitochondria enter the egg cell during fertilization. They’re left outside with the flagellum as the sperm nucleus alone enters the egg. Therefore, no paternal mitochondria become part of the zygote (the fertilized egg).
Hence, the male’s genetic contribution to the offspring consists of his haploid genome only (1), and not his mitochondrial genes. The female, by contrast, contributes both her haploid set of nuclear genes (5) and her mitochondria (6).
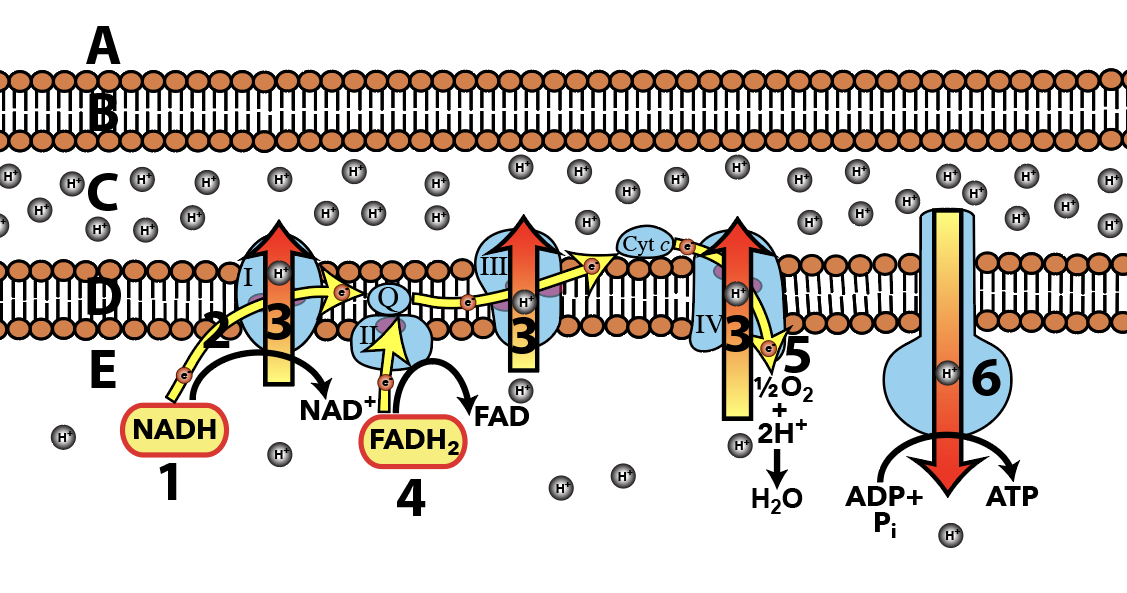
What are these 37 mitochondrial genes? Fourteen are protein-coding genes related to cellular respiration. These genes code for the subunits of ATP synthase (6 at right), cytochrome c (a protein in the mitochondrial electron transport chain), and NADH dehydrogenases (the enzymes that harvest electrons from NADH, oxidizing NADH to NAD+). The rest of the genes code for the small and large subunits of the mitochondrial ribosome, and 22 mitochondrial tRNAs.
Mitochondrial DNA has a higher mutation rate than nuclear genes, and mutations in mitochondrial genes are associated with a variety of diseases. These diseases are called mitochondrial myopathies and they have their primary effect on nervous and muscle tissue. You can read more about these on Wikipedia.
Because mitochondria are passed through egg cells only (with no contribution from the sperm), mitochondrial genes have a unique inheritance pattern.

In row I, we see a mother (I-2) with a mitochondrial condition. Such conditions are passed by the mother to all of her offspring: hence I-2’s sons at II-1 and II-5 and her daughters at II-3 and II-7 all inherit the condition. In the next generation, we see that the sons at II-1 and II-5 do not pass the condition on to their offspring, but the daughters (II-3 and II-7) pass it on to all of their offspring.
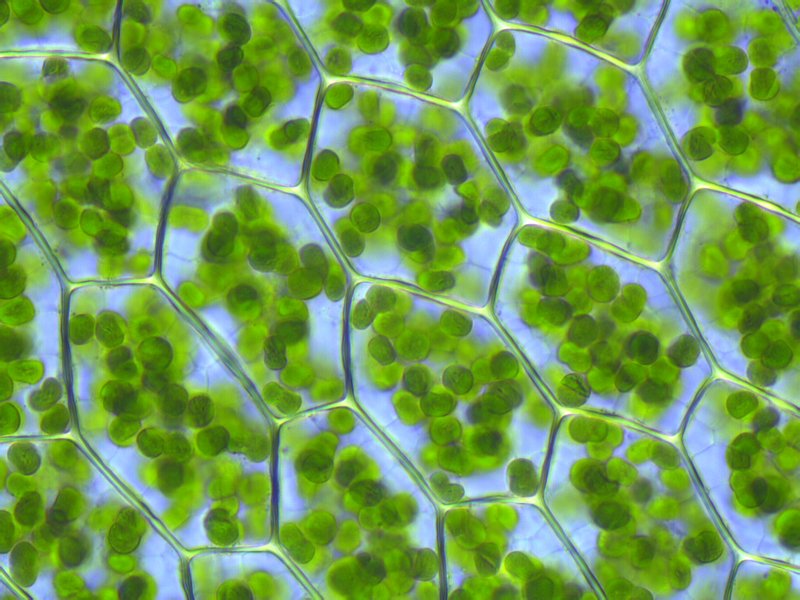
Plant cells also have mitochondria, plus an additional endosymbiont: the chloroplast. Like mitochondria, chloroplasts also have their own DNA. This DNA codes for about 110 genes.
Chloroplast genes code for proteins related to photosynthesis, and for RNAs and proteins involved in chloroplast gene expression (ribosomes, tRNAs, etc.).

In the same way that the sperm cells in animals don’t contribute mitochondrial genes, plant pollen (which is analogous to sperm in animals) doesn’t contribute chloroplast genes (or mitochondrial genes). So in plants, we have a situation where the ovum (egg cell) contributes a haploid genome, mitochondrial DNA, and chloroplast DNA to the fertilized egg, while the pollen contributes only a haploid genome.
[qwiz qrecord_id=”sciencemusicvideosMeister1961-mitochondrial Inheritance (v2.0)”]
[h] Mitochondrial and Chloroplast Inheritance
[i]
[q multiple_choice=”true”] Because of mitochondrial genes, you’re more closely related to your
[c]IHNpc3RlciB0aGFuIHlvdSBhcmUgdG8geW91ciBicm90aGVy[Qq]
[f]IE5vLiBBbGwgc2libGluZ3MgaW5oZXJpdCBhYm91dCA1MCUgb2YgdGhlaXIgbnVjbGVhciBnZW5lcyBmcm9tIHRoZWlyIHBhcmVudHMgYW5kIDEwMCUgb2YgdGhlaXIgbWl0b2Nob25kcmlhbCBnZW5lcyBmcm9tIHRoZWlyIG1vdGhlcnMuIEl0IGRvZXNuJiM4MjE3O3QgbWF0dGVyIGlmIHRoYXQgc2libGluZyBpcyBtYWxlIG9yIGZlbWFsZS4=[Qq]
[c]IG1vdGhlciB0aGFuIHlvdSBh cmUgdG8geW91ciBmYXRoZXIu[Qq]
[f]IEV4YWN0bHkuIFlvdSBzaGFyZSBleGFjdGx5IDUwJSBvZiB5b3VyIG51Y2xlYXIgZ2VuZXMgd2l0aCB5b3VyIG1vdGhlciBhbmQgeW91ciBmYXRoZXIgKHdobyBzaGFyZWQgdGhlbSB3aXRoIHlvdSB0aHJvdWdoIHRoZWlyIGVnZyBhbmQgc3Blcm0gY2VsbHMpLiBCdXQgeW91IHNoYXJlIDEwMCUgb2YgeW91ciBtb3RoZXImIzgyMTc7cyBtaXRvY2hvbmRyaWFsIGdlbmVzIGFuZCBub25lIG9mIHlvdXIgZmF0aGVyJiM4MjE3O3MgbWl0b2Nob25kcmlhbCBnZW5lcy4=[Qq]
[q] The diagram below illustrates how you inherit all of your mitochondria from your mother’s [hangman], but none from your father’s [hangman].
[c]IGVnZw==[Qq]
[c]IHNwZXJt[Qq]
[q] Mitochondria that you don’t inherit are indicated by the number
[textentry single_char=”true”]
[c]ID I=[Qq]
[f]IE5pY2UuICYjODIyMDsyJiM4MjIxOyBhcmUgbWl0b2Nob25kcmlhIGluIHRoZSBzcGVybSwgd2hpY2ggZG9uJiM4MjE3O3QgZ2V0IHBhc3NlZCBvbiB0byB0aGUgb2Zmc3ByaW5nLg==[Qq]
[c]IEVudGVyIHdvcmQ=[Qq]
[c]ICo=[Qq]
[f]IE5vLiBZb3UmIzgyMTc7cmUgbG9va2luZyBmb3IgbWl0b2Nob25kcmlhIHRoYXQgY29tZSBmcm9tIHlvdXIgZmF0aGVyLCBub3QgZnJvbSB5b3VyIG1vdGhlci4=[Qq]
[q] The mitochondria that you inherit are indicated by the number
[textentry single_char=”true”]
[c]ID Y=[Qq]
[f]IENvcnJlY3QuICYjODIyMDs2JiM4MjIxOyBhcmUgbWl0b2Nob25kcmlhIGluIHRoZSBlZ2csIHdoaWNoIGFyZSB0aGUgb25lcyB0aGF0IGdldCBwYXNzZWQgb24gdG8gb2Zmc3ByaW5nLg==[Qq]
[c]IEVudGVyIHdvcmQ=[Qq]
[c]ICo=[Qq]
[f]IE5vLiBZb3UmIzgyMTc7cmUgbG9va2luZyBmb3IgbWl0b2Nob25kcmlhIHRoYXQgY29tZSBmcm9tIHlvdXIgbW90aGVyLiBMb29rIGluIHRoZSBlZ2cgY2VsbC4=[Qq]
[q multiple_choice=”true”]In the pedigree chart below, you know that the inheritance is not mitochondrial because
[c]VGhlIG1vdGhlciBpbiBnZW5lcmF0aW9uIEkgcGFzc2VkIG9uIHRoZSB0cmFpdCB0byBhbGwgb2YgaGVyIG9mZnNwcmluZy4=[Qq]
[f]Tm8uIFRoYXQmIzgyMTc7cyBhIGNvcnJlY3Qgc3RhdGVtZW50IGFib3V0IG1pdG9jaG9uZHJpYWwgaW5oZXJpdGFuY2UsIGJ1dCBpdCYjODIxNztzIG5vdCB3aGF0JiM4MjE3O3MgaGFwcGVuaW5nIGluIHRoaXMgcGVkaWdyZWUuIEluIHRoaXMgcGVkaWdyZWUsIHRoZSBtb3RoZXIgZG9lc24mIzgyMTc7dCBoYXZlIHRoZSB0cmFpdCwgYnV0IGFsbCBvZiBoZXIgb2Zmc3ByaW5nIGRvIGhhdmUgaXQuIEluIG1pdG9jaG9uZHJpYWwgaW5oZXJpdGFuY2UsIHRoZSBtb3RoZXIgcGFzc2VzIHRoZSB0cmFpdCBvbiB0byBhbGwgb2YgaGVyIG9mZnNwcmluZy4=[Qq]
[c]VGhlIG1vdGhlciBpbiBnZW5lcmF0aW9uIElJIChJSS0zKSBvbmx5IHBhc3NlZC BvbiBoZXIgdHJhaXQgdG8gdGhyZWUgb2YgaGVyIGZpdmUgb2Zmc3ByaW5nLg==[Qq]
[f]VGhhdCYjODIxNztzIGNvcnJlY3QuIEluIG1pdG9jaG9uZHJpYWwgaW5oZXJpdGFuY2UsIHRoZSBtb3RoZXIgcGFzc2VzIG9uIGhlciB0cmFpdCB0byA=YWxsIG9mIGhlciBvZmZzcHJpbmcu[Qq]
[c]VGhlIGZhdGhlciBpbiBnZW5lcmF0aW9uIDEgcGFzc2VkIG9uIHRoZSB0cmFpdCB0byBhbGwgb2YgaGlzIG9mZnNwcmluZy4=[Qq]
[f]Tm8uIEluIG1pdG9jaG9uZHJpYWwgaW5oZXJpdGFuY2UsIHRoZSA=bW90aGVyIHBhc3NlcyBvbiBoZXIgdHJhaXQgdG8gYWxsIG9mIGhlciBvZmZzcHJpbmcu[Qq]
[q]Most mitochondrial genes are involved in mitochondrial gene expression or
[c]YWVyb2JpYyByZX NwaXJhdGlvbg==[Qq]
[f]WWVzLiBNaXRvY2hvbmRyaWFsIGdlbmVzIGFyZSBpbnZvbHZlZCBpbiBtaXRvY2hvbmRyaWFsIGdlbmUgZXhwcmVzc2lvbiBvciBjZWxsdWxhciByZXNwaXJhdGlvbi4=[Qq]
[c]cHJvdGVpbiBleHBvcnQu[Qq]
[f]Tm8uIFRoaW5rIG9mIGEgbWl0b2Nob25kcmlhbCBmdW5jdGlvbi4=[Qq]
[c]TWl0b3Npcw==[Qq]
[f]Tm8uIFRoaW5rIG9mIGEgbWl0b2Nob25kcmlhbCBmdW5jdGlvbi4=[Qq]
[q]The two organelles that contain their own genes are the [hangman], which are involved in cellular respiration, and the [hangman], which carries out photosynthesis.
[c]bWl0b2Nob25kcmlh[Qq]
[c]Y2hsb3JvcGxhc3Q=[Qq]
[q]In plants, pollen only contributes [hangman] genes. By contrast, the ovum (egg) contributes genes that are found in the photosynthetic [hangman] and the [hangman], which carry out cellular respiration.
[c]bnVjbGVhcg==[Qq]
[c]Y2hsb3JvcGxhc3Q=[Qq]
[c]bWl0b2Nob25kcmlh[Qq]
[/qwiz]
2. Incomplete Dominance
With incomplete dominance, we’re back to nuclear genes.
Let’s start with a widely known example of a new inheritance pattern. This occurs with the inheritance of flower color in snapdragons. Answer the question below.
[qwiz]
[h]Crossing snapdragons (P generation)
[q] If a purebred red-flowered snapdragon is crossed with a purebred white-flowered snapdragon, what color will the offspring be?
[c]IFNob3cgbWUgdG hlIGFuc3dlcg==[Qq]
[f]IFRoZSBvZmZzcHJpbmcgYXJlIHBpbmsu
Cg==Cg==[Qq]That’s not what you’d expect after learning about Mendel’s experiments with peas, where a true-breeding purple and tree breeding white produce all purple flowers in the F1 generation. Read below to see what’s going on.
[/qwiz]
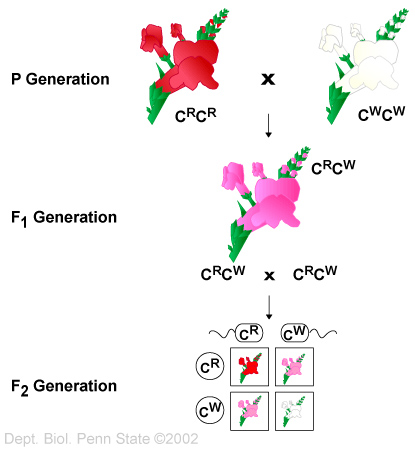 The inheritance pattern that’s at work in flower color inheritance in snapdragons is called incomplete dominance. Incomplete dominance occurs when the phenotype of a heterozygote is different from (and usually intermediate between) either of the homozygous phenotypes.
In snapdragons, neither the red color allele nor the white color allele is dominant. As a result, we adopt a different notation system.
- CR represents the red flower color allele.
- CW represents the white flower color allele.
In a P generation cross between a homozygous red-flowered snapdragon (genotype CRCR) and a homozygous white-flowered snapdragon (genotype CWCW), the offspring’s genotype is CRCW, and the phenotype is pink.
In the F1 cross between two pink heterozygotes (genotype CRCW), you get a phenotype (and genotype) ratio of 1 red offspring: to two pink offspring: to one white offspring.
On a molecular/cellular level, what’s happening with incomplete dominance? Let’s stick with snapdragons. For a snapdragon flower to be red, imagine that the cells in the flower need two doses of red pigment. To express that amount of pigment, you need to have both alleles, something that only occurs in a homozygous red individual with genotype CRCR. Each one of these CR alleles is going to be expressed as red pigment protein, producing a bright red color.
Now, imagine the situation of the cells in a snapdragon heterozygote, whose genotype is CRCW. A single red pigment allele is present, and as a result, only half as much red pigment protein is going to be produced in the heterozygotes as will be produced in a red homozygote. In this case, there’s not enough red pigment protein to produce a bright red color. Instead, we get pink.
That leads to an important insight. The difference between “traditional” dominance and incomplete dominance might depend on how closely you look. Think of sickle cell anemia. Looking at an entire individual, from the outside, the sickle cell phenotype only shows up in homozygous recessives. But if you use a microscope and look at the blood of a heterozygote, you see that there’s some sickling that occurs in heterozygotes. And if you analyze the hemoglobin protein in heterozygotes, you find that about 60% of the hemoglobin is normal (HbA), and about 40% is the mutated version of the protein (HbS). That difference is evolutionarily important. It gives sickle cell heterozygotes resistance to malaria, a devastating tropical disease. That leads to natural selection for the sickle cell allele, increasing the frequency of this otherwise deadly allele in malaria-infested areas. You can learn more about this in this tutorial on Learn-Biology.com.
Here’s another example of incomplete dominance. In chickens, the CB allele codes for black feathers, while the CW allele codes for white feathers. A heterozygote with genotype CBCW has blue feathers.
Knowing that, solve the following problems.
[qwiz qrecord_id=”sciencemusicvideosMeister1961-Incomplete dominance in chickens (v2.0)”]
[h]Solving incomplete dominance problems in chickens
[i]
[q]In a cross between two heterozygote chickens, genotype CBCW, the offspring will be
[c]MTAwJSBibHVlIGZlYXRoZXJlZA==[Qq]
[f]Tm8uIEhlcmUmIzgyMTc7cyBob3cgdG8gc2V0IHVwIHRoZSBQdW5uZXR0IHNxdWFyZQ==
Cg==| [Qq] | CB | CW |
| CB | ||
| CW |
As with any Punnett square, bring the alleles in the gametes together to form the zygotes, and interpret the results.
[c]MTAwJSBXaGl0ZSBmZWF0aGVyZWQ=[Qq]
[f]Tm8uIEhlcmUmIzgyMTc7cyBob3cgdG8gc2V0IHVwIHRoZSBQdW5uZXR0IHNxdWFyZQ==
Cg==| [Qq] | CB | CW |
| CB | ||
| CW |
As with any Punnett square, bring the alleles in the gametes together to form the zygotes, and interpret the results.
[c]NzUlIGJsYWNrIGZlYXRoZXJlZCwgMjUlIHdoaXRlIGZlYXRoZXJlZA==[Qq]
[f]Tm8uIEhlcmUmIzgyMTc7cyBob3cgdG8gc2V0IHVwIHRoZSBQdW5uZXR0IHNxdWFyZQ==
Cg==| [Qq] | CB | CW |
| CB | ||
| CW |
As with any Punnett square, bring the alleles in the gametes together to form the zygotes, and interpret the results.
[c]NTAlIGJsdWUgZmVhdGhlcmVkLCAyNSUgYmxhY2sgZm VhdGhlcmVkLCAyNSUgd2hpdGUgZmVhdGhlcmVkLg==[Qq]
[f]RXhjZWxsZW50LiBIZXJlJiM4MjE3O3MgdGhlIFB1bm5ldHQgc3F1YXJl
Cg==| [Qq] | CB | CW |
| CB | CBCB | CBCW |
| CW | CBCW | CWCW |
25% are black(CBCB), 50% blue (CBCW), and 25% white (CWCW)
[q]In a cross between a blue heterozygote chicken, genotype CBCW, and a white chicken, the offspring will be
[c]NTAlIGJsdWUsID UwJSB3aGl0ZQ==[Qq]
[f]V2F5IHRvIGdvISBIZXJlJiM4MjE3O3MgdGhlIFB1bm5ldHQgc3F1YXJlLg==
Cg==| [Qq] | CB | CW |
| CW | CBCW | CWCW |
| CW | CBCW | CWCW |
50% of the offspring have the genotype CBCW and a blue feathered phenotype. The other 50% have the genotype CWCW and a white feathered phenotype.
[c]MTAwJSBibGFjaw==[Qq]
[f]Tm8uIEhlcmUmIzgyMTc7cyBob3cgdG8gc2V0IHVwIHRoZSBQdW5uZXR0IHNxdWFyZQ==
Cg==| [Qq] | CB | CW |
| CW | ||
| CW |
As with any Punnett square, bring the alleles in the gametes together to form the zygotes, and interpret the results.
[c]NTAlIGJsYWNrLCA1MCUgd2hpdGU=[Qq]
[f]Tm8uIEhlcmUmIzgyMTc7cyBob3cgdG8gc2V0IHVwIHRoZSBQdW5uZXR0IHNxdWFyZQ==
Cg==| [Qq] | CB | CW |
| CW | ||
| CW |
As with any Punnett square, bring the alleles in the gametes together to form the zygotes, and interpret the results.
[/qwiz]
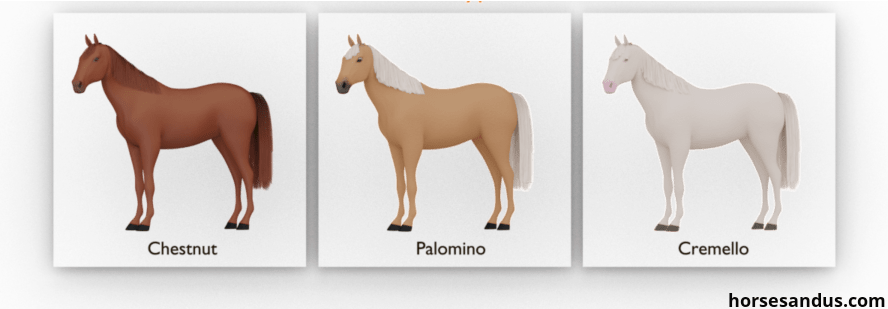
Another animal trait that shows incomplete dominance is the Palomino phenotype in horses, which comes about through crossing a Chesnut-coated horse and a Cremello-coated horse.
Since humans are animals, many genes probably involve incomplete dominance (as with the sickle cell trait above). In terms of the easily observed traits that people seem to enjoy speculating about, it’s thought that wavy hair is due to incomplete dominance between alleles for curly hair and straight hair (though different sources explain this quite differently: click here for a reasonable discussion of hair texture from the Tech Museum in San Jose).

However, note that height in humans is not an example of incomplete dominance. Rather, like many traits (intelligence, skin color, strength, athleticism, eye color, and many more), human height is controlled by multiple genes that interact in complex ways (and which are further influenced by the environment—see below). That makes human height a polygenic trait (a trait that’s under the influence of multiple interacting genes).
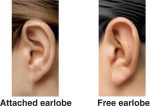
Interestingly, free and attached earlobes. which is often taught as a case of simple Mendelian inheritance in humans, is probably also a polygenic trait. A recent study indicates that earlobe attachment might involve dozens of genes.
Finally, note that incomplete dominance works differently from the co-dominant pattern that we saw with blood type. In co-dominance, both alleles are completely expressed. For example, let’s look at the A, B, and O blood type system. If you are a heterozygote who inherits an A allele and a B allele, then you express both the A and the B glycoprotein. There’s nothing in-between (in the way that pink is in between white and red).

To review co-dominance and blood type, please go to this tutorial.
3. Pleiotropy
Pleiotropy occurs when one gene
- influences multiple traits or
- has multiple effects on an organism’s phenotype.
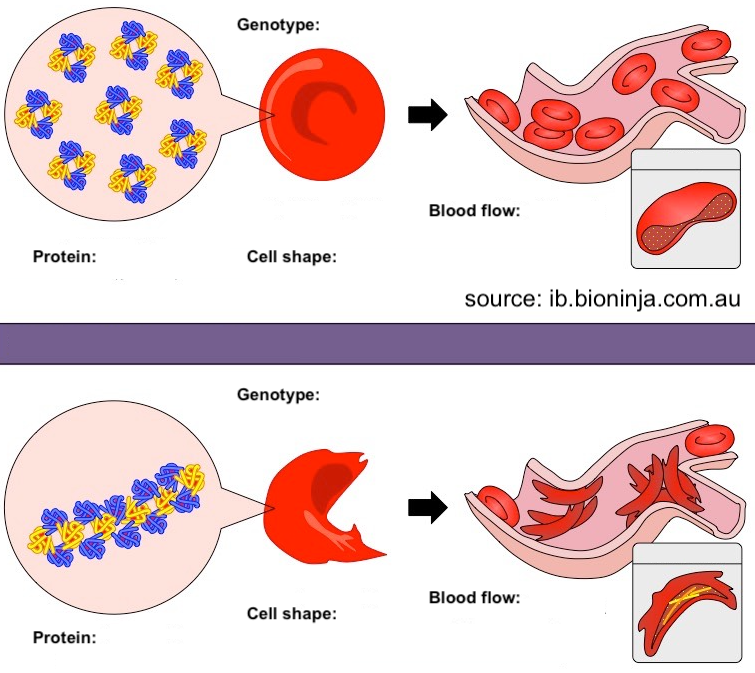
A classic example of pleiotropy is the sickle cell allele, which we’ve looked at several times in this course, and which we’ll look at again in Unit 7 in the context of evolution.
Sickle cell anemia is an autosomal recessive condition, caused by a mutation of an allele on chromosome 11. The normal version of the allele codes of hemoglobin, the molecule that carries oxygen in red blood cells. The mutant sickle cell allele has one altered nucleotide that results in a single amino acid substitution (non-polar valine for polar glutamic acid). Normal hemoglobin (with glutamic acid) never binds with other hemoglobin molecules. In the mutant form, hydrophobic interactions cause hemoglobin molecules to chain together. This causes red blood cells to become sickled, and these sickled cells get stuck in capillaries (the body’s smallest blood vessels). This causes additional symptoms: pain crises and tissue and organ damage. This array of symptoms from one genetic defect is what pleiotropy is all about.
All of the effects described above are negative. However, another pleiotropic effect of the sickle cell allele is to provide, in heterozygotes, resistance to the mosquito-borne parasitic disease malaria. We’ll see in Unit 7 that this advantage to heterozygotes has led to an astonishingly high frequency of the sickle cell allele in human populations in parts of Africa where malaria is prevalent.
Cystic fibrosis is the most common genetic disorder among North Americans of European descent. It’s also an autosomal recessive condition with pleiotropic effects. The cystic fibrosis allele, found on chromosome 7, codes for a membrane protein channel (the CFTR channel) in the cells that line the surfaces of the inner lining of the lungs, pancreatic ducts, sperm ducts, and the intestines.
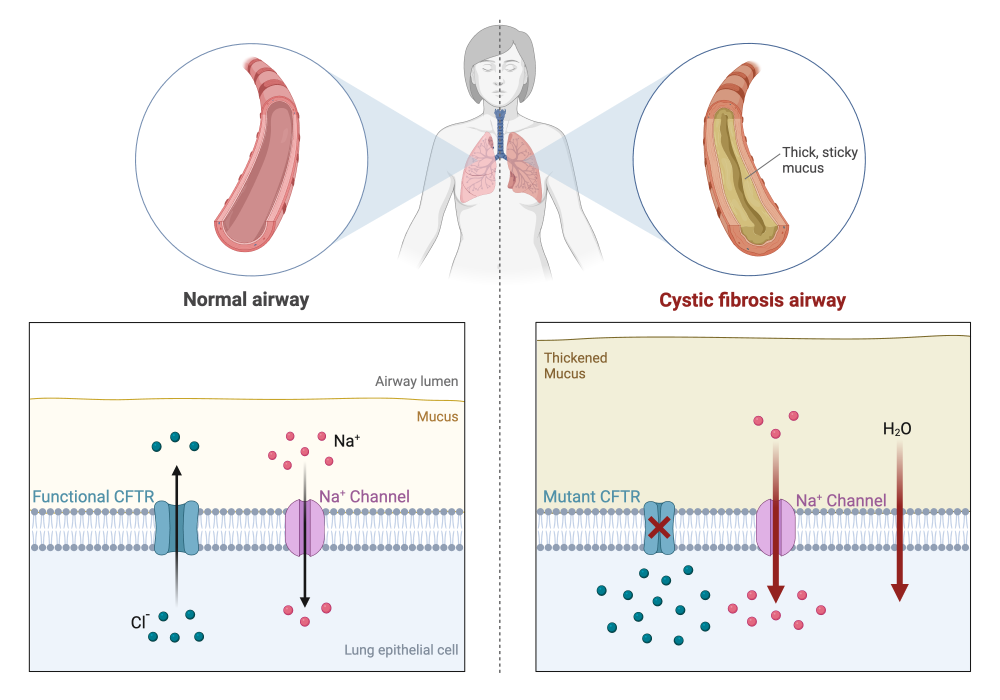
In people without cystic fibrosis, the normal CFTR channel allows the chloride ion (Cl–) to diffuse out of cells, as shown on the left side of the diagram. The mutated CFTR channel (shown on the right side of the diagram) blocks the passage of chloride, which is trapped within the cells. The presence of this negative ion draws positive sodium ions (Na+) into the cells, and the presence of both ions makes the cells hypertonic to the extracellular environment. This draws water into the cells, and away from the watery mucus that lines the cells. The result is that the mucus becomes thicker than normal, trapping bacteria in the lungs that would normally be swept away. This leads to infections, inflammation and tissue damage.
But this is an allele with pleiotropic effects, and that’s just the start of the symptoms. The same mucus buildup occurs in the pancreatic ducts. The ducts become blocked, preventing digestive enzymes that are produced in the pancreas from reaching the intestine. The faulty CFTR channel also affects male sexual development, frequently causing male infertility. Males still produce sperm, but the sperm are unable to exit the testes. Malfunction of the CFTR channel in sweat glands keeps chloride from being reabsorbed from sweat back into the body. High levels of chloride in the sweat cause sodium ions to flow from skin cells into the sweat. This causes people with cystic fibrosis to have saltier sweat than normal people: that basis of the sweat test that is an early diagnostic test for cystic fibrosis.
4. Genotype-Environment Interaction
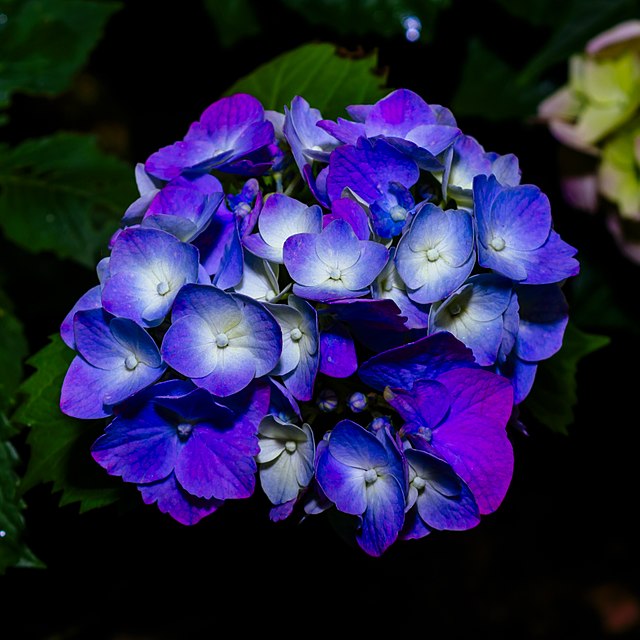
Hydrangeas are ornamental shrubs grown for their beautifully colored flower heads (which consist of dozens or hundreds of flowers) These can come in a variety of colors, as shown below.
 |
 |
What causes some hydrangeas to be blue, while others are red (or white)? After studying the inheritance of flower color in peas and snapdragons, a reasonable assumption would be that the color of these flower heads would be controlled by genes. But it’s not.
If you want blue hydrangeas in your garden, there’s a simple way to do that: make the soil in which your hydrangea is growing acidic. If you want red hydrangeas, make your soil basic. (To read more about the biology of hydrangea colors, read this article in the American Scientist).
The effect of the environment upon an organism’s genotype to bring about different phenotypes is called genotype-environment interaction. The basic idea is that genes aren’t all-powerful. Rather, the interaction between an organism’s genotype and its environment is what determines the phenotype of the organism.
 Here’s another example from the plant world. Think of two trees, one growing deep in a forest, protected from wind, the second growing in an area exposed to the wind. The form of those trees will be different, with the wind-exposed tree looking like what you see on the right.
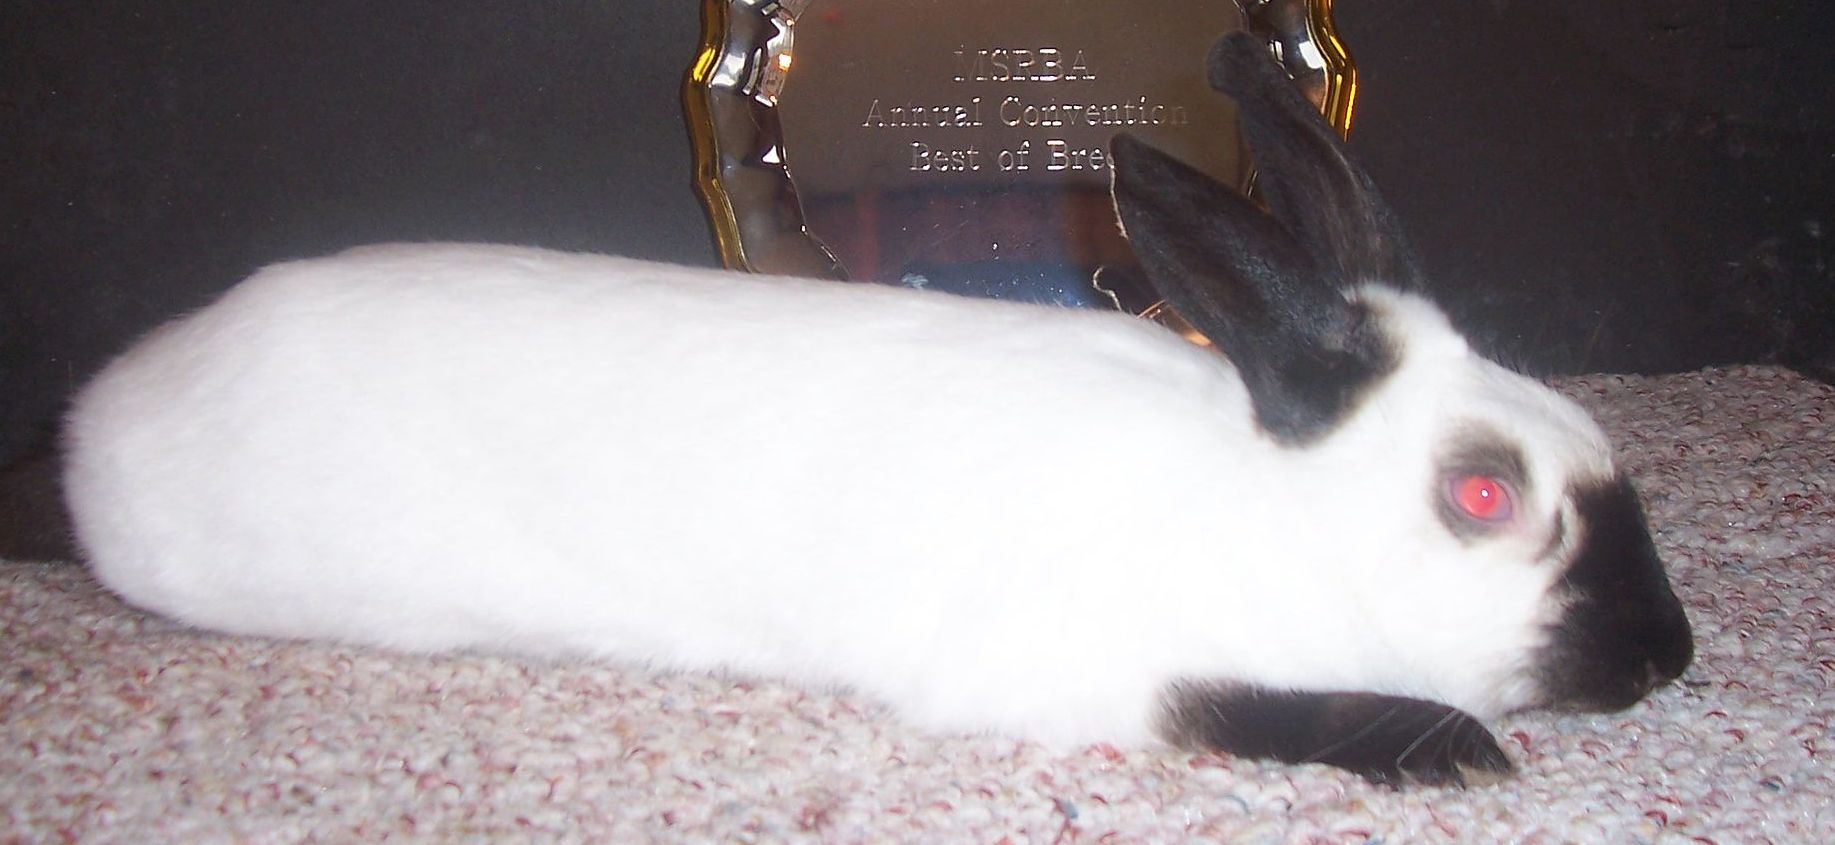
- Start with a rabbit (or another animal) with the typical coloration pattern.
- Shave a patch of fur off of what is typically a warmer body region, and place a cooling pack on that body region while the fur is growing back.
- When the fur has regrown, it’ll show the dark color typically shown in warmer body regions.

While the environment often influences gene expression and the resulting phenotype of an organism, in some cases the genotype is deterministic. Consider a few conditions that are determined by genes in humans. A child born as a homozygote for Tay-Sachs disease will die of that condition within a few years. If you inherit the allele for Huntington’s disease (a dominant allele), you’ll express the symptoms of this neurological disease sometime around middle age, and eventually, die from it.
But even single gene-related disorders can be influenced by interaction with the environment. Read this passage from Wikipedia about phenylketonuria, an enzyme deficiency disease.
Phenylketonuria (PKU) is a human genetic condition caused by mutations to a gene coding for a particular liver enzyme. In the absence of this enzyme, an amino acid known as phenylalanine does not get converted into the next amino acid in a biochemical pathway, and therefore too much phenylalanine passes into the blood and other tissues. This disturbs brain development leading to [intellectual disabilities] and other developmental problems.
PKU affects approximately 1 out of every 15,000 infants in the U.S. However, most affected infants do not grow up impaired because of a standard screening program used in the U.S. and other industrialized societies. Newborns found to have high levels of phenylalanine in their blood can be put on a special, phenylalanine-free diet. If they are put on this diet right away and stay on it, these children avoid the severe effects of PKU. This example shows that a change in environment (lowering Phenylalanine consumption) can affect the phenotype of a particular trait, demonstrating a gene–environment interaction.
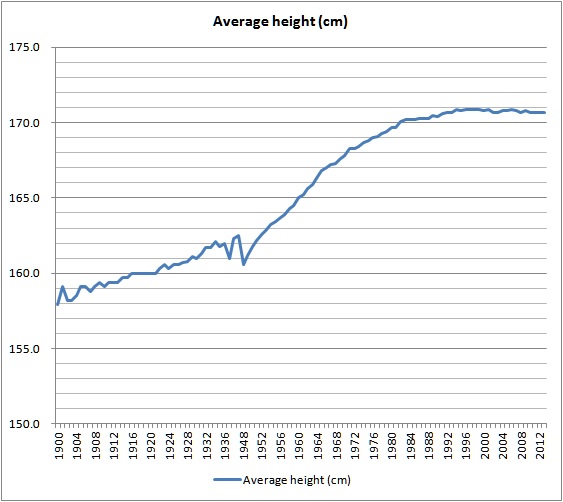
Here’s an example on a population level. The graph to your left shows the average height of men in Japan between 1900 and 2012. What accounts for the rapid increase in height after 1945 (the end of World War II)?
The environment changed. After its defeat in World War II, Japan’s culture became more influenced by American culture. This included adopting North American eating patterns, including a higher amount of meat and fat in the diet. In response to this change, the mean phenotype of Japanese men changed (note: the average height of Japanese women increased as well but by a smaller amount (source)).
To a large degree, the entire field of epigenetics is about genotype-environment interactions and their effects on gene expression. We’ll take on the details of epigenetic and gene expression in AP Bio Unit 6.
5. Cumulative Quiz
Got it? Take the quiz below.
[qwiz qrecord_id=”sciencemusicvideosMeister1961-Incomplete Dominance, Genotype-Environment, Mitochondrial Inheritance (v2.0)”]
[h]Incomplete dominance, Genotype -Environment Interaction, Pleiotropy, and Mitochondrial Inheritance
[i]
[q labels=”top”]
| Genotype | Phenotype | Description |
| CRCR | _______ | _______________ |
| CWCW | _______ | _______________ |
| CRCW | _______ | _______________ |
[l]pink
[fx] No, that’s not correct. Please try again.
[f*] Great!
[l]red
[fx] No, that’s not correct. Please try again.
[f*] Correct!
[l]white
[fx] No, that’s not correct. Please try again.
[f*] Excellent!
[l]homozygous
[fx] No, that’s not correct. Please try again.
[f*] Excellent!
[l]heterozygous
[fx] No. Please try again.
[f*] Good!
[q multiple_choice=”true”]In a cross between two pink snapdragons, the expected phenotype ratio is
[c]MTAwJSBwaW5r[Qq]
[f]Tm8uIFN0dWR5IHRoZSBQdW5uZXR0IFNxdWFyZSBiZWxvdyBhbmQgdHJ5IGFnYWluLg==
Cg==[Qq]
[c]NTAlIHJlZDogNTAlIHdoaXRl[Qq]
[f]Tm8uIFN0dWR5IHRoZSBQdW5uZXR0IFNxdWFyZSBiZWxvdyBhbmQgdHJ5IGFnYWluLg==
Cg==[Qq]
[c]MjUlIHJlZDogNTAlIHBp bms6wqAgMjUlIHdoaXRl[Qq]
[f]RXhjZWxsZW50ISBIZXJlJiM4MjE3O3MgdGhlIFB1bm5ldHQgc3F1YXJl
Cg==[Qq]
[c]NzUlIHJlZDogMjUlIHdoaXRl[Qq]
[f]Tm8uIFN0dWR5IHRoZSBQdW5uZXR0IFNxdWFyZSBiZWxvdyBhbmQgdHJ5IGFnYWluLg==
Cg==[Qq]
[q multiple_choice=”true”] Which of the following is the best definition of incomplete dominance?
[c]SW4gaGV0ZXJvenlnb3RlcywgdGhlIGRvbWluYW50IGFsbGVsZSBtYXNrcyB0aGUgZXhwcmVzc2lvbiBvZiB0aGUgcmVjZXNzaXZlIGFsbGVsZS4=[Qq]
[f]Tm8uIFRoYXQmIzgyMTc7cyBhIHByZXR0eSBnb29kIGRlZmluaXRpb24gb2YgaG93IGRvbWluYW50IGFuZCByZWNlc3NpdmUgYWxsZWxlcyB3b3JrLg==[Qq]
[c]SW4gaGV0ZXJvenlnb3RlcywgYm90aCBhbGxlbGVzIGFyZSBlcXVhbGx5IGV4cHJlc3NlZCBpbiB0aGUgcGhlbm90eXBlIG9mIHRoZSBvZmZzcHJpbmcu[Qq]
[f]Tm8uIFRoYXQmIzgyMTc7cyBhIGRlZmluaXRpb24gb2YgQ28tZG9taW5hbmNlLCBzdWNoIGFzIHdpdGggQUIgYmxvb2QgdHlwZS4gQm90aCB0aGUgQSBhbmQgdGhlIEIgcHJvdGVpbnMgYXJlIGV4cHJlc3NlZC4=[Qq]
[c]SW4gaGV0ZXJvenlnb3RlcywgdGhlIHBoZW5vdHlwZSBvZiB0aGUgaGV0ZXJvenlnb3RlIGlz IGludGVybWVkaWF0ZSBiZXR3ZWVuIHRoZSB0d28gaG9tb3p5Z291cyBwaGVub3R5cGVzLg==[Qq]
[f]TmljZSBqb2IhIFRoYXQmIzgyMTc7cyBhIGdyZWF0IGRlZmluaXRpb24gb2YgaW5jb21wbGV0ZSBkb21pbmFuY2Uu[Qq]
[q multiple_choice=”true”]The most reasonable explanation for the pink color of heterozygous snapdragons is that
[c]VGhlIGhldGVyb3p5Z290ZXMgZXhwcmVzcyB0b28gbXVjaCByZWQgcGlnbWVudCwgcmVzdWx0aW5nIGluIHRoZWlyIHBpbmsgY29sb3Iu[Qq]
[f]Tm8uIEhvdyBjb3VsZCB0b28gbXVjaCByZWQgcGlnbWVudCByZXN1bHQgaW4gYSBwaW5rPw==[Qq]
[c]VGhlIGhldGVyb3p5Z290ZXMgYXJlbiYjODIxNzt0IHByb2R1Y2luZyBl bm91Z2ggcmVkIHBpZ21lbnQgdG8gY3JlYXRlIHJlZCBmbG93ZXJzLg==[Qq]
[f]WWVzLiBXaXRoIG9ubHkgb25lIGFsbGVsZSBmb3IgcmVkLCB0aGVyZSYjODIxNztzIG5vdCBzdWZmaWNpZW50IHJlZCBwaWdtZW50IGJlaW5nIHByb2R1Y2VkIHRvIGNyZWF0ZSBhIGJyaWdodCByZWQgY29sb3Iu[Qq]
[c]VGhlIHdoaXRlIGFsbGVsZSBpbiB0aGUgaGV0ZXJvenlnb3RlcyBwcm9kdWNlcyBhIHByb3RlaW4gdGhhdCBibG9ja3MgdGhlIGV4cHJlc3Npb24gb2YgdGhlIHJlZCBhbGxlbGUu[Qq]
[f]IE5vJiM4MjMwO0lmIHRoYXQgd2VyZSB0cnVlLCB0aGVuIHdoaXRlIHdvdWxkIGJlIGRvbWluYW50IG92ZXIgcmVkLiBDaG9vc2UgYW5vdGhlciBhbnN3ZXIu[Qq]
[q multiple_choice=”true”]The pedigree below is best explained by
[c]bWl0b2Nob25kcmlhbC Bpbmhlcml0YW5jZQ==[Qq]
[f]TmljZS4gWW91IGlkZW50aWZpZWQgdGhlIGtleSBwYXR0ZXJuOiB0aGUgbW90aGVyIHBhc3NlcyBvbiBoZXIgbWl0b2Nob25kcmlhbCBnZW5lcyB0byBhbGwgb2YgaGVyIG9mZnNwcmluZy4=[Qq]
[c]SW5jb21wbGV0ZSBkb21pbmFuY2U=[Qq]
[f]Tm8uIEhlcmUmIzgyMTc7cyBhIGRlZmluaXRpb24gZm9yIGluY29tcGxldGUgZG9taW5hbmNlOiBJbiBoZXRlcm96eWdvdGVzLCB0aGUgcGhlbm90eXBlIG9mIHRoZSBoZXRlcm96eWdvdGUgaXMgaW50ZXJtZWRpYXRlIGJldHdlZW4gdGhlIHR3byBob21venlnb3VzIHBoZW5vdHlwZXMuIA==SXQgZG9lc24mIzgyMTc7dCBzZWVtIGxpa2UgdGhlcmUmIzgyMTc7cyBhbnkgZXZpZGVuY2UgZm9yIHRoZSBibGVuZGluZyBvZiBwaGVub3R5cGVzLg==[Qq]
[c]IHNleC1saW5rZWQgaW5oZXJpdGFuY2U=[Qq]
[f]Tm8uIEluIGEgc2V4LWxpbmtlZCB0cmFpdCwgYSBtYWxlIHBhc3NlcyBvbiBhbiBhbGxlbGUgdGhhdCByZXNpZGVzIG9uIGhpcyBYIGNocm9tb3NvbWUgdG8gaGlzIGRhdWdodGVycy4gQmVjYXVzZSB0aGUgYWxsZWxlIGlzIG9uIHRoZSBYIGNocm9tb3NvbWUsIHRoZSBtYWxlIGNhbiYjODIxNzt0IHBhc3MgaXQgb24gdG8gaGlzIHNvbnMuIFRoYXQgcGF0dGVybiBkb2VzbiYjODIxNzt0IHNlZW0gdG8gYmUgYXQgd29yayBoZXJlLg==[Qq]
[q]If an allele is on the DNA found at “1” or “5” below, we know that a gene coded for by that DNA can’t be [hangman].
[c]bWl0b2Nob25kcmlhbA==[Qq]
[q]A gene that’s passed on through mitochondrial inheritance would have to be on which number below?
[textentry single_char=”true”]
[c]ID Y=[Qq]
[f]IENvcnJlY3QuICYjODIyMDs2JiM4MjIxOyBhcmUgbWl0b2Nob25kcmlhIGluIHRoZSBlZ2csIHdoaWNoIGFyZSB0aGUgb25lcyB0aGF0IGdldCBwYXNzZWQgb24gdG8gb2Zmc3ByaW5nIGluIG1pdG9jaG9uZHJpYWwgaW5oZXJpdGFuY2U=[Qq]
[c]IEVudGVyIHdvcmQ=[Qq]
[c]ICo=[Qq]
[f]IE5vLiBZb3UmIzgyMTc7cmUgbG9va2luZyBmb3IgdGhlIG1pdG9jaG9uZHJpYSB0aGF0IGNvbWUgZnJvbSB5b3VyIG1vdGhlci4gTG9vayBpbiB0aGUgZWdnIGNlbGwu[Qq]
[q]A tall woman and a short man have a child of intermediate height. Though this looks like incomplete dominance, it’s not. That’s because height in humans is a [hangman] trait.
[c]cG9seWdlbmlj[Qq]
[q multiple_choice=”true”]Inheritance of blood types A, B, AB, or O is an example of
[c]cG9seWdlbmljIGluaGVyaXRhbmNl[Qq]
[f]Tm8uIFRoZXJlJiM4MjE3O3Mgb25seSBvbmUgZ2VuZSAodGhvdWdoIGl0IGhhcyBtdWx0aXBsZSBhbGxlbGVzKS4gVGhpbmsgYWJvdXQgaG93ICYjODIyMDtBJiM4MjIxOyBhbmQgJiM4MjIwO0ImIzgyMjE7IGFyZSBleHByZXNzZWQu[Qq]
[c]aW5jb21wbGV0ZSBkb21pbmFuY2U=[Qq]
[f]Tm8uIEluIGluY29tcGxldGUgZG9taW5hbmNlLCB5b3UgZ2V0IGFuIGludGVybWVkaWF0ZSBwaGVub3R5cGUuICYjODIyMDtBQiYjODIyMTsgaXMgbm90IGludGVybWVkaWF0ZSBiZXR3ZWVuIEEgYW5kIEI6IGl0JiM4MjE3O3MgYSBmdWxsIGV4cHJlc3Npb24gb2YgYm90aC4=[Qq]
[c]Z2Vub3R5cGUtZW52aXJvbm1lbnQgaW50ZXJhY3Rpb24=[Qq]
[f]Tm8uIEJsb29kIHR5cGUgaXMgbm90IGluZmx1ZW5jZWQgYnkgdGhlIGVudmlyb25tZW50LCBidXQgb25seSBieSBnZW5lcy4=[Qq]
[c]Q28tZG9t aW5hbmNl[Qq]
[f]TmljZWx5IGRvbmUuIFRoZSBBQk8gYmxvb2QgdHlwZSBzeXN0ZW0gaXMgYW4gZXhhbXBsZSBvZiBDby1kb21pbmFudCBpbmhlcml0YW5jZS4=[Qq]
[q]The color of hydrangeas can be determined by the acidity of the soil that the hydrangea plant is growing in. That makes hydrangea coloration an example of genotype-[hangman] interaction.
[c]ZW52aXJvbm1lbnQ=[Qq]
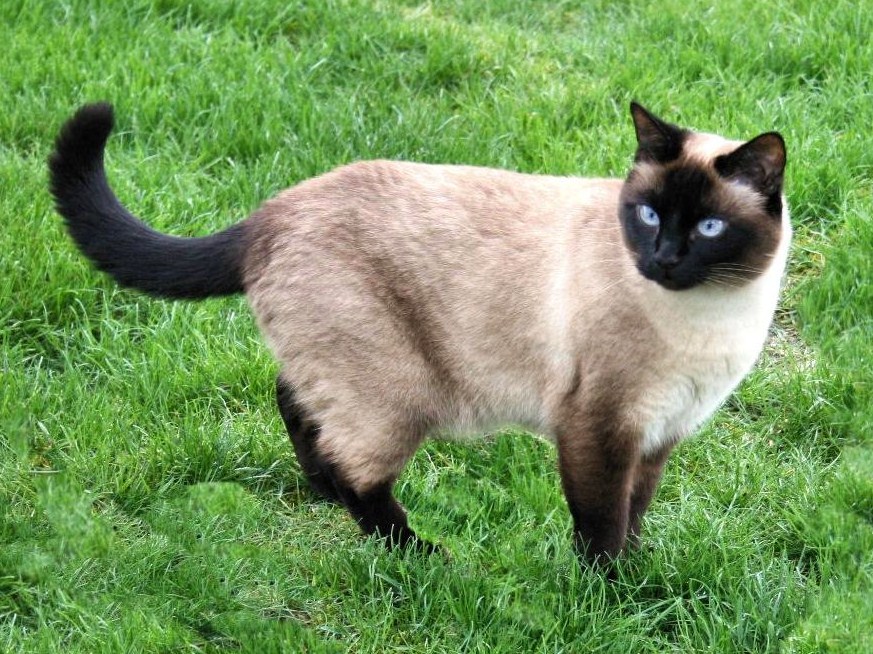
[q multiple_choice=”true”]The color pattern on a siamese cat is best explained by which of the following.
[c]VGhlIGVuenltZSBmb3IgZXhwcmVzc2luZyBtZWxhbmluIChkYXJrIHBpZ21lbnQpIGlzIGRlbmF0dXJlZCBieSBjb2xkLCByZXN1bHRpbmcgaW4gZGFyayBmdXIgaW4gdGhlIGNvb2xlc3QgcGFydCBvZiB0aGUgYm9keS4=[Qq]
[f]Tm8uIElmIHRoZSBlbnp5bWUgZm9yIGRhcmsgcGlnbWVudCB3YXMgZGVuYXR1cmVkIGJ5IGNvbGQsIGhvdyBjb3VsZCBkYXJrIHBpZ21lbnQgYmUgZXhwcmVzc2VkIG9ubHkgaW4gdGhlIGNvb2xlc3QgcGFydCBvZiB0aGUgYm9keT8=[Qq]
[c]VGhlIGVuenltZSBmb3IgZXhwcmVzc2luZyBtZWxhbmluIGlzIHNlbnNpdGl2ZSB0byBncmF2aXR5LCBhbmQgb25seSBleHByZXNzZWQgaW4gdGhlIGxvd2VzdCBwYXJ0cyBvZiB0aGUgYm9keS4=[Qq]
[f]Tm8uIFRoYXQgbWlnaHQgbWFrZSBzZW5zZSBmb3IgdGhlIGZlZXQsIGJ1dCBub3QgZm9yIHRoZSBlYXJzLg==[Qq]
[c]VGhlIGVuenltZSBmb3IgZXhwcmVzc2luZyBtZWxhbmluIGlzIGFjdGl2YXRlZCBieSBjb29sZXIgdGVtcGVyYXR1cmVzLCBhbmQgb25s eSBleHByZXNzZWQgaW4gcGFydHMgb2YgdGhlIGJvZHkgdGhhdCBhcmUgZnVydGhlc3QgZnJvbSB0aGUgY29yZSBvZiB0aGUgYm9keS4=[Qq]
[f]WWVzLiBUaGF0JiM4MjE3O3Mgd2h5IHlvdSBoYXZlIHRoZSBwYXR0ZXJuIG9mIGNvb2xlciBib2R5IHBhcnRzIGhhdmluZyBkYXJrZXIgY29sb3JhdGlvbi4=[Qq]
[q]True or false: Genotype environment interaction only shows up in polygenic traits, like height, body weight, and overall intelligence.
[c]VHJ1ZQ==[Qq]
[f]Tm8uIEV2ZW4gdHJhaXRzIGNvbnRyb2xsZWQgYnkgc2luZ2xlIGdlbmVzLCBsaWtlIHRoZSBnZW5lIGZvciBQS1UgZGlzZWFzZSwgY2FuIGJlIGluZmx1ZW5jZWQgYnkgdGhlIGluZGl2aWR1YWwmIzgyMTc7cyBlbnZpcm9ubWVudC4=[Qq]
[c]RmFs c2U=[Qq]
[f]RXhjZWxsZW50LiBUaGUgZXhwcmVzc2lvbiBwYXR0ZXJuIG9mIG1hbnkgZ2VuZXMgaXMgc3ViamVjdCB0byB0aGUgaW50ZXJhY3Rpb24gYmV0d2VlbiB0aGUgZ2VuZSBhbmQgaXRzIGVudmlyb25tZW50LiBUaGlzIGluY2x1ZGVzIHRyYWl0cyBjb250cm9sbGVkIGJ5IGEgc2luZ2xlIGdlbmUsIGxpa2UgUEtVIGRpc2Vhc2Uu[Qq]
[q][hangman] is when one allele causes an array of symptoms.
[c]cGxlaW90cm9weQ==[Qq]
[q multiple_choice=”true”]In humans, a condition called Marfan syndrome is associated with
- Unusually tall height
- Thin fingers and toes
- Dislocation of the lens of the eye
- Heart problems (in which the aorta, the large blood vessel carrying blood away from the heart, bulges or ruptures).
All of these symptoms can be traced back to a single mutation in a gene called FBN1, which encodes a protein called fibrillin-1, an important component of connective tissues.
Which of the following terms best describes the action of the Marfan syndrome allele?
[c]aW5jb21wbGV0ZSBkb21pbmFuY2Uu[Qq]
[f]Tm8uIFlvdSYjODIxNztyZSBsb29raW5nIGZvciB0aGUgdGVybSB0aGF0IGRlc2NyaWJlcyB3aGVuIG9uZSBnZW5lIGFmZmVjdHMgbXVsdGlwbGUgY2hhcmFjdGVyaXN0aWNzLg==[Qq]
[c]cGxlaW90 cm9weQ==[Qq]
[f]RXhjZWxsZW50LiBNYXJmYW4gc3luZHJvbWUgaXMgYW4gZXhhbXBsZSBvZiBwbGVpb3Ryb3B5Lg==[Qq]
[c]cG9seWdlbmljIGluaGVyaXRhbmNl[Qq]
[f]Tm8uIFBvbHlnZW5pYyBpbmhlcml0YW5jZSBvY2N1cnMgd2hlbiBhIHRyYWl0LCBsaWtlIGhlaWdodCwgaXMgZGV0ZXJtaW5lZCBieSB0aGUgY29tYmluZWQgZWZmZWN0cyBvZiB0d28gb3IgbW9yZSBnZW5lcywgZWFjaCBjb250cmlidXRpbmcgYSBzbWFsbCBhZGRpdGl2ZSBlZmZlY3QgdG8gdGhlIHBoZW5vdHlwZS4gWW91JiM4MjE3O3JlIGxvb2tpbmcgZm9yIHRoZSB0ZXJtIHRoYXQgZGVzY3JpYmVzIHdoZW4gb25lIGdlbmUgYWZmZWN0cyBtdWx0aXBsZSBjaGFyYWN0ZXJpc3RpY3Mu[Qq]
[c]bXVsdGlwbGUgYWxsZWxlcw==[Qq]
[f]Tm8uIE11bHRpcGxlIGFsbGVsZXMgcmVmZXJzIHRvIHRoZSBwcmVzZW5jZSBvZiBtb3JlIHRoYW4gdHdvIGFsbGVsZXMgZm9yIGEgc2luZ2xlIGdlbmUgd2l0aGluIGEgcG9wdWxhdGlvbiwgZXZlbiB0aG91Z2ggYW55IGluZGl2aWR1YWwgY2FuIG9ubHkgY2FycnkgdHdvIGFsbGVsZXMgKG9uZSBmcm9tIGVhY2ggcGFyZW50KS4gWW91JiM4MjE3O3JlIGxvb2tpbmcgZm9yIHRoZSB0ZXJtIHRoYXQgZGVzY3JpYmVzIHdoZW4gb25lIGdlbmUgYWZmZWN0cyBtdWx0aXBsZSBjaGFyYWN0ZXJpc3RpY3Mu[Qq]
[x]
[restart]
[/qwiz]
What’s Next?
Congratulations! With this tutorial, you’ve covered all of the learning objections in AP Bio Unit 5. To consolidate your understanding, proceed to these Unit 5 Cumulative Objectives, Flashcards, and Quizzes.
