Question of the day # 3
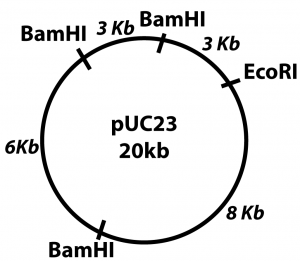
QoD # 3: With reference to this plasmid map, do the following:
PART 1: Explain how restriction enzymes work.
Restriction enzymes are enzymes that can find a specific sequence of nucleotides within a stretch of DNA, and make a cut at a specific point within that sequence.
PART 2: Explain what a DNA fingerprint is, and how a DNA fingerprint can be created through gel electrophoresis.
Gel electrophoresis involves placing molecules in a porous gel. Running an electrical current through the gel will cause the molecules placed in the gel to be sorted by size and electrical charge. This technique works particularly well with nucleic acids like DNA and RNA. That’s because the phosphate groups in these molecules’ sugar-phosphate backbone are negatively charged. This will move the molecules away from the negatively charged side of an electrophoresis chamber, and toward the positive side. At the same time, small fragments will be less impeded by the gel than large fragments, meaning that during the same period of time, smaller fragments will move more than larger ones, enabling the fragments to be sorted by size.
If these fragments are stained the result is a DNA fingerprint.
The diagram below shows a summary of the whole process, and a DNA fingerprint is shown at letter J. 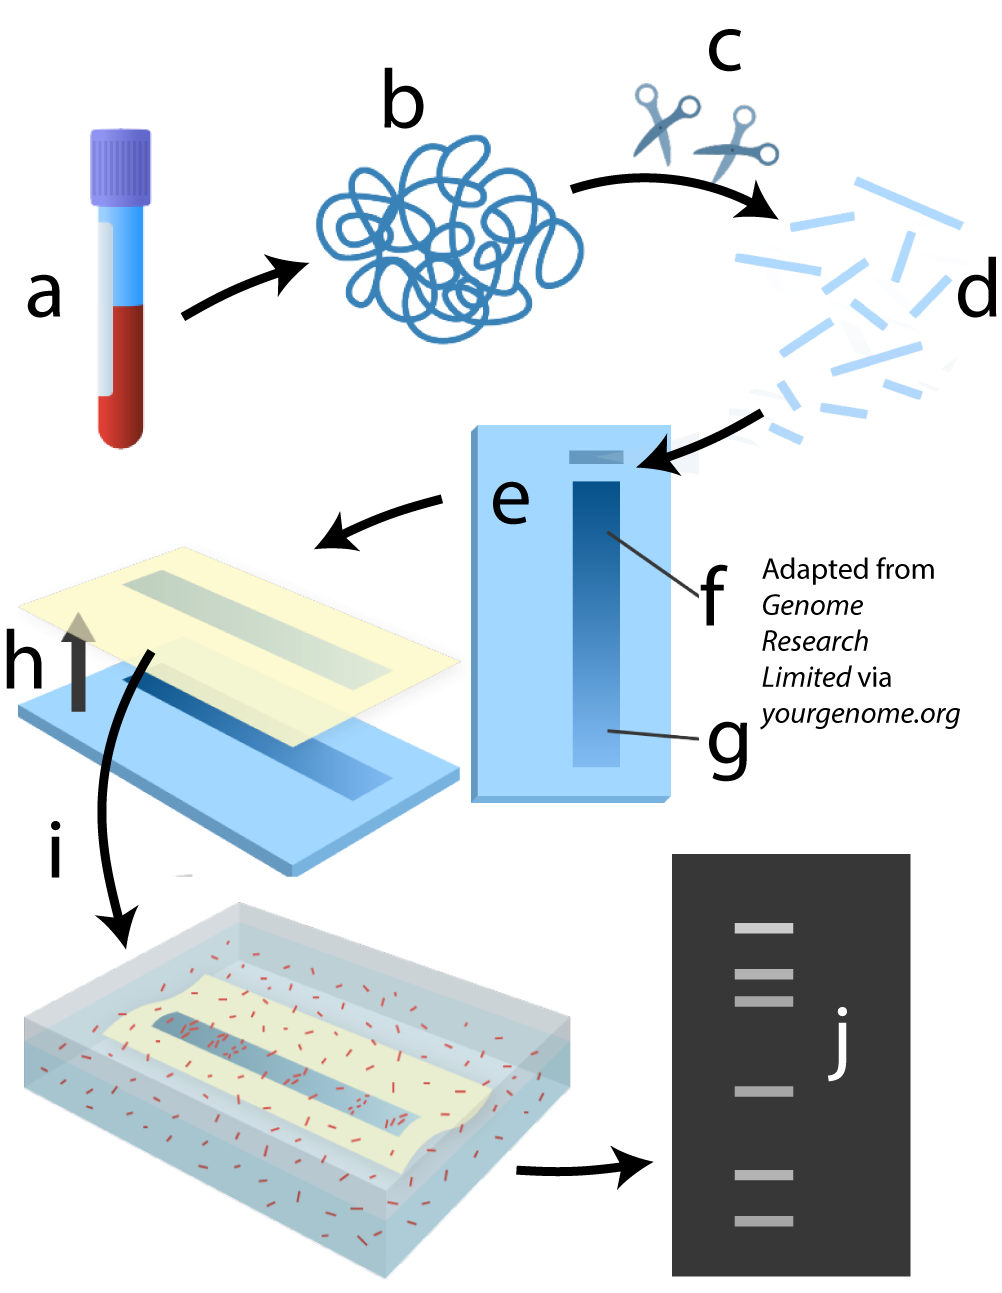
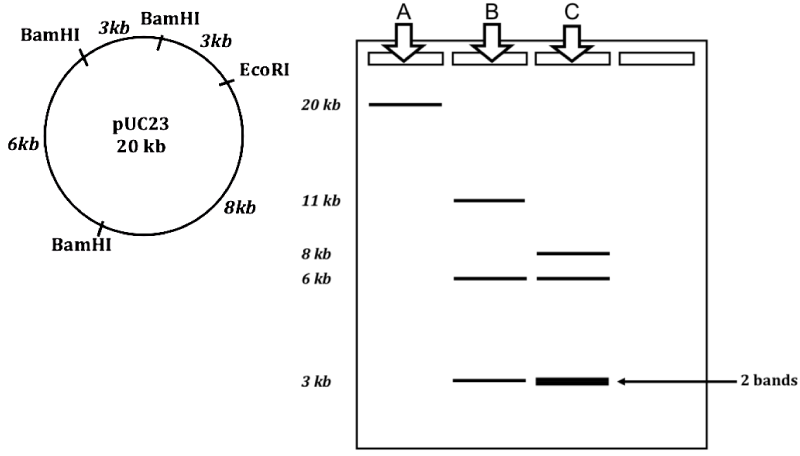
PART 3. Predict the DNA fingerprints that would results from electrophoresis following
- Digestion with each restriction enzyme separately.
- Digestion with both restriction enzymes together.
Lane A shows the single fragment that would result from use of the restriction enzyme EcoR1.
Lane B shows the result of BamH1: one 3 kB fragment; one 11 kB fragment, and one 6 kB fragment.
Lane C shows the result of using BamH1 and EcoR1 together: two 3 kB fragments (which is why the line is thicker at 3 kb), one 8 kB fragment, and one 6 kB fragment.
Question of the Day # 2
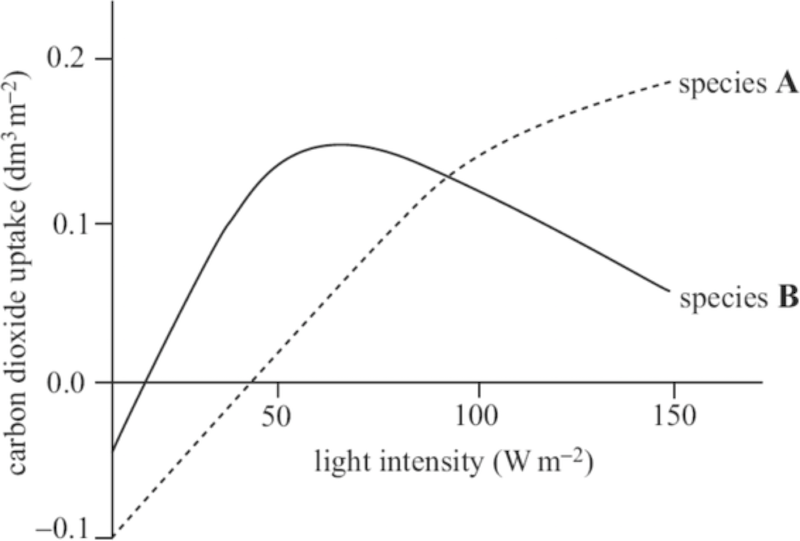
QOD # 2: The graph below shows the relationship between carbon dioxide uptake and light intensity in two plant species, A and B. One of these species is adapted to living in full sun, while the other is adapted to shade.
PART 1: Explain what processes can be measured by measuring carbon dioxide uptake.
PART 2: Using TWO pieces of information from this graph, determine which species is adapted to living in the shade. Explain your answer.
PART 3: Identify the species with the lower rate of respiration. Explain how this can be determined from the graph.
PART 4: Describe the significance that a low rate of respiration could have for this plant in its natural habitat.
PART 1: CO2 is consumed during photosynthesis (where it’s an input for formation of carbohydrate). CO2 is produced during cellular respiration. CO2 uptake indirectly measures the difference between the rates of photosynthesis and respiration, which also provides a measure of growth
PART 2: Species B lives in the shade. This is indicated by 1) it reaches its maximum rate of CO2 uptake at a much lower light intensity than species A, 2) its CO2 uptake is lower in high light intensities, suggesting it is unable to make good use of increased light.
PART 3: Species B has a lower rate of respiration. At light intensity of zero, the plant is giving out 0.05 dm3/m-2 CO2 through respiration compared to 0.1dm3/m-2 in species A.
PART 4:The amount by which total photosynthesis exceeds respiration determines the growth rate of a plant. Plant B is adapted to living in shady light conditions. Because of low light intensities in the shade, plant B would have a reduced rate of photosynthesis. A low rate of respiration would result in less glucose being broken down, thus more available for growth.
Question of the Day # 1
QOD # 1: The diagram below represents signal transduction.
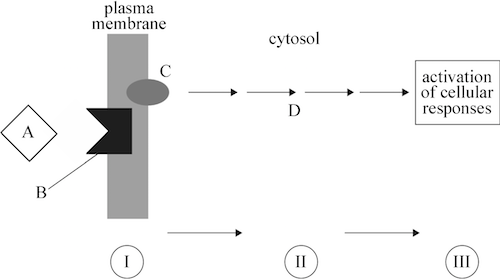
PART 1: Explain how the initiation of signal transduction ensures that a cell’s response to a signal will be controlled and specific.
PART 2: List the type of molecules that generally act as intermediate or relay molecules.
PART 3: In a multicellular organism, signals can come in various forms. Explain how you know that in the system shown above, the ligand is NOT a steroid hormone.
PART 4: Describe a specific example of a cellular response that could occur in the kind of system depicted above.
PART 1: Complementarity of shape between the ligand and the receptor ensures that only cells with the target receptor respond to the signal.
PART 2: A common second messenger is cAMP; others include IP3 (inositol trisphosphate), and calcium ions.
PART 3:In this system, the ligand is binding at the membrane, making it most likely a protein hormone. Steroid hormones would diffuse through the membrane and bind with a cytoplasmic receptor. A hormone-receptor complex would then diffuse into the nucleus.
PART 4: One example of possible cellular response is activation of enzymes, such as when liver cells respond to epinephrine by activating enzymes that break down glycogen into glucose as part of the fight or flight response. (note: MANY other examples are possible)

