1. Signal Transduction
QOD # 1: The diagram below represents signal transduction.
![]()
PART 1: Explain how the initiation of signal transduction ensures that a cell’s response to a signal will be controlled and specific.
PART 2: List the type of molecules that generally act as intermediate or relay molecules.
PART 3: In a multicellular organism, signals can come in various forms. Explain how you know that in the system shown above, the ligand is NOT a steroid hormone.
PART 4: Describe a specific example of a cellular response that could occur in the kind of system depicted above.
2. CO2 Uptake and Light Intensity
QOD # 2: The graph below shows the relationship between carbon dioxide uptake and light intensity in two plant species, A and B. One of these species is adapted to living in full sun, while the other is adapted to shade.
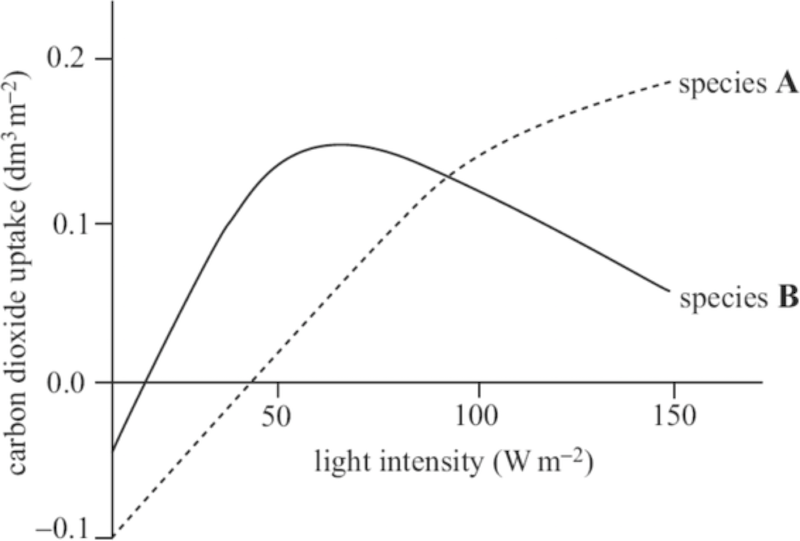
PART 1: Explain what processes can be measured by measuring carbon dioxide uptake.
PART 2: Using TWO pieces of information from this graph, determine which species is adapted to living in the shade. Explain your answer.
PART 3: Identify the species with the lower rate of respiration. Explain how this can be determined from the graph.
PART 4: Describe the significance that a low rate of respiration could have for this plant in its natural habitat.
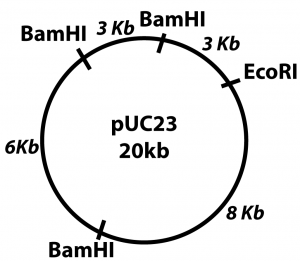
3. Plasmids, Restriction Enzymes, Gel Electrophoresis, and DNA Fingerprinting
QoD # 3: With reference to this plasmid map, do the following:
PART 1: Explain how restriction enzymes work.
PART 2: Explain what a DNA fingerprint is, and how a DNA fingerprint can be created through Gel Electrophoresis.
PART 3. Predict the DNA fingerprints that would results from electrophoresis following
- Digestion with each restriction enzyme separately.
- Digestion with both restriction enzymes together.
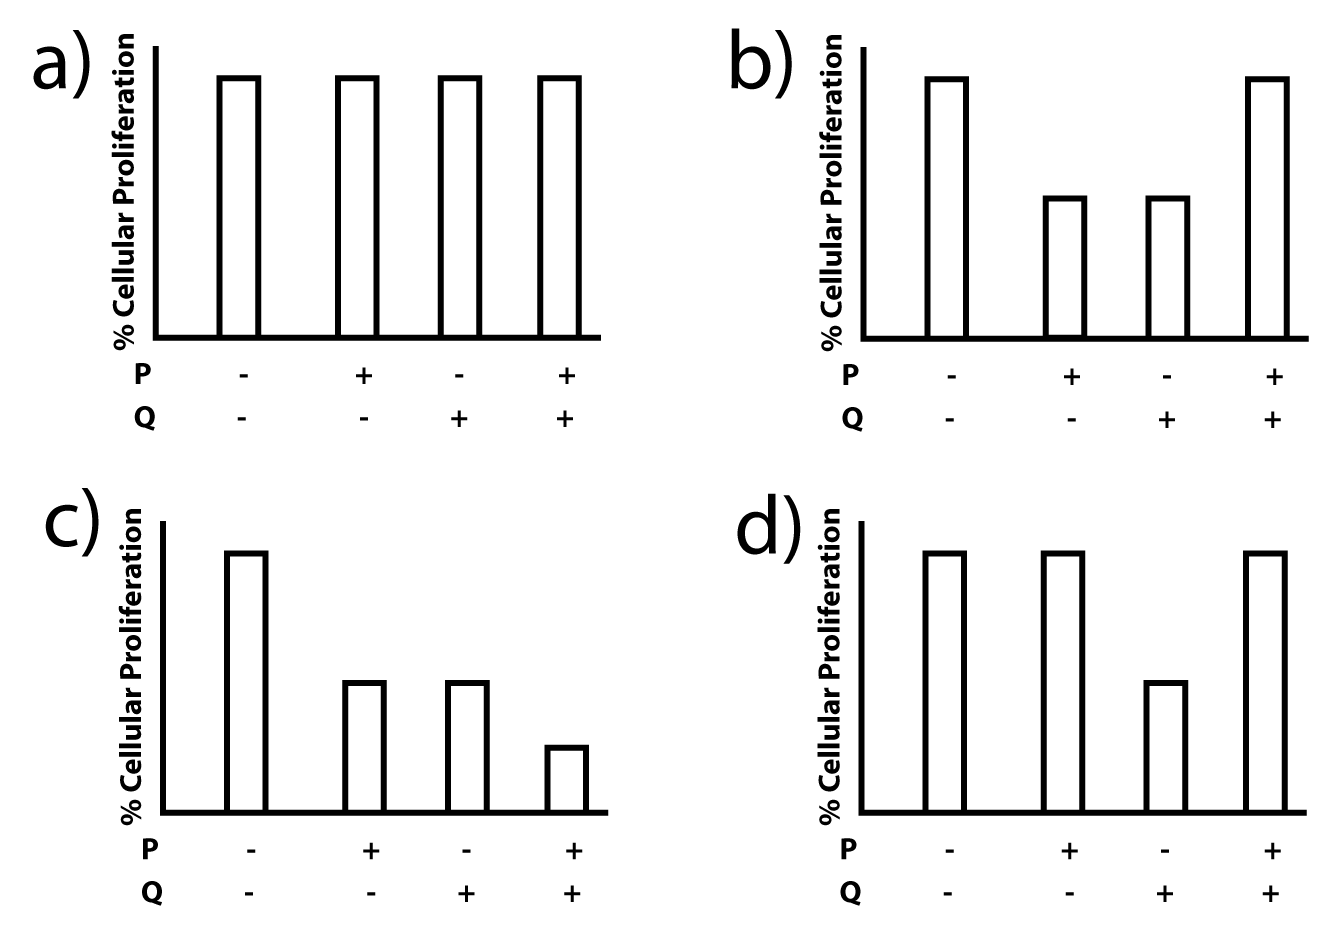
4. Cancer drugs and their Effect on Cellular Proliferation
Proto-oncogenes, when they mutate to become oncogenes, can cause cells to become cancerous.A lysogenic virus infects a particular cell type and integrates its genome into a site that contains a proto-oncogene. This transforms the cell and increases the level of a protein X. Protein X, in turn, increases cellular proliferation (division and spread).
Tumor suppressor genes code for proteins that prevent cells from becoming cancerous. A compound P is known to increase the level of tumor suppressor proteins in that cell type. A second compound, Q helps in stimulating protein Z. Protein Z has been shown to be capable of binding to X rendering it inactive.
In the graphs at right, a minus sign indicates that substance P or Q was not applied to experimental cell cultures, while a plus sign indicates that substance P or Q was applied.
Identify which of the following graphs correctly represents the mode of action of P and Q. Justify your response.
5. Hormone Action
Epinephrine, also known as adrenaline, is produced by the adrenal glands. The structural formula for epinephrine is shown below.

These next two diagrams are general models for signal reception and transduction.
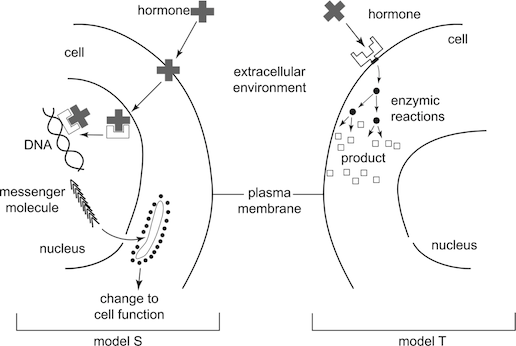
PART 1: Identify which model, S or T, best corresponds to the mechanism of epinephrine. Justify your response.
PART 2: While epinephrine has effects throughout the body, some tissues are not affected. Explain.
PART 3: Identify the model, S or T, that would bring about longer lasting effects. Justify your response.
6. Disrupted Systems
This was my attempt at combining FRQ review with spoken word. Hope you like it!
7. Experimental Design
Question of the Day Playlist