1. Introduction: What is a DNA Fingerprint?
|
Fingerprint |
Four DNA Fingerprints |
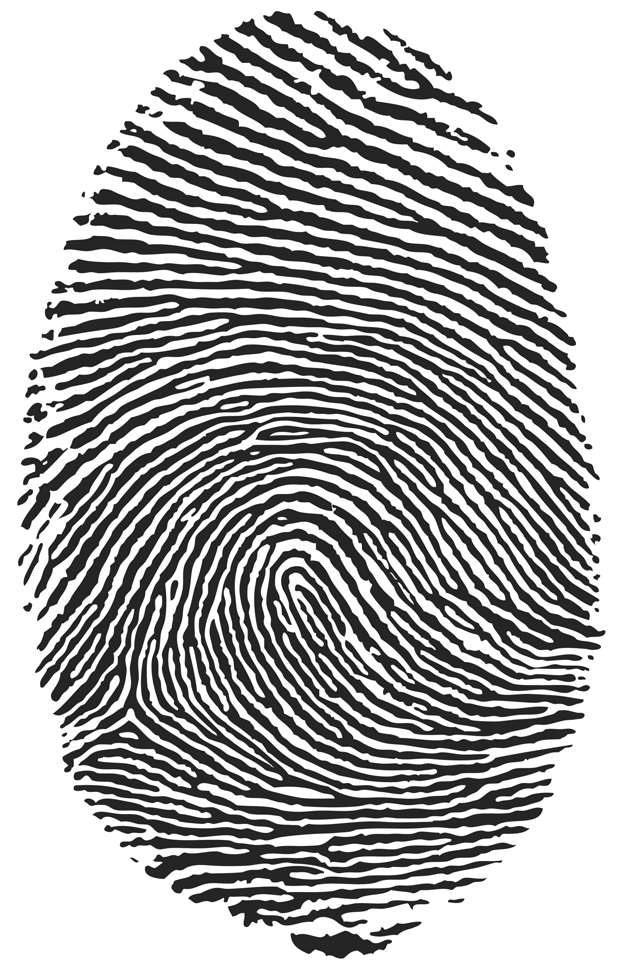
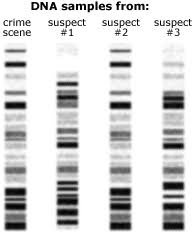
Unless you’re an identical twin, your DNA is unique. DNA fingerprinting or profiling involves chemically manipulating DNA to create a unique pattern, like the four shown above (one from a crime scene, and one for each of the three suspects in the crime). The pattern can also be a series of numbers, each corresponding to a feature in a person’s DNA.
DNA fingerprinting is widely used in research, and for the past 30 years has been a mainstay of forensics (crime investigation).
2. RFLPs (Restriction Fragment Length Polymorphisms)
An early method for creating a DNA fingerprint was based on restriction fragments. These segments of DNA are created by bacterial enzymes called restriction endonucleases (frequently referred to as restriction enzymes). These enzymes were discussed in the first tutorial in this module (and you should read about them now if you’re doing this tutorial before that one)
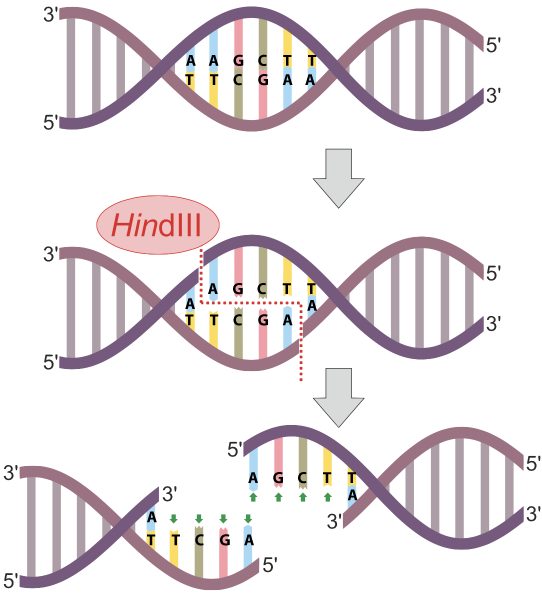
In the diagram at left, the restriction endonuclease HindIII recognizes the nucleotide sequence AAGCTT and cuts the DNA between the two As. Note that because the sequence is a palindrome (it’s the same in the 5′ to 3′ direction on both strands), the cut winds up being double-stranded, and completely severs the DNA.

If you were to take my DNA and put it into a vial with restriction enzymes, my DNA would be cut into fragments. Why? Because along the length of the billions of bases in my DNA, there are going to be a few instances of restriction site sequences. At these restriction sites, the restriction enzyme will cut up my DNA into restriction fragments.
Now, here’s where the creation of restriction fragments ties into profiling and fingerprinting. A restriction site is a sequence of nucleotide bases. While most of the DNA shared by any two humans is the same, there are differences: that’s what makes us genetically distinct. If those differences are within a restriction site, then the number of the restriction fragments created when the DNA from any two people is treated with the same restriction enzyme will also differ, as will the length of those fragments.
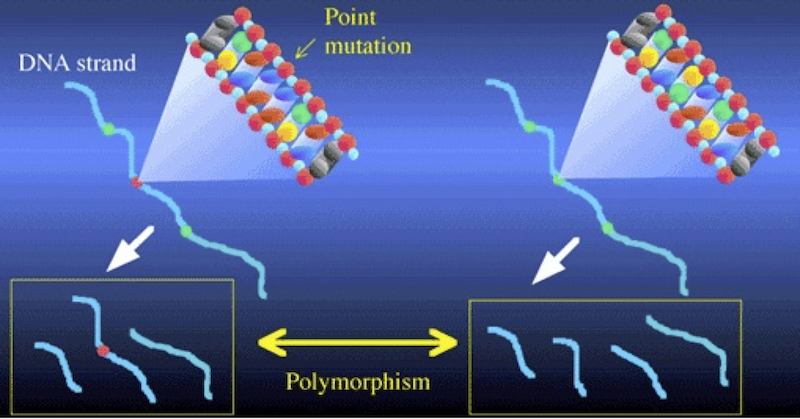
Consider the illustration above. It shows two DNA strands. The sequence on the right has three restriction sites (represented in green), and when cut with the corresponding restriction enzyme, that DNA will be cut into four fragments. In the DNA on the left, there’s been a mutation in the second restriction site (shown in red). As a result, the corresponding restriction enzyme won’t recognize that site, and won’t cut the DNA at that point. Consequently, the left sample of DNA is cut into three fragments, while the right sample is cut into four. Note also how in the DNA strand on the left, the combination of the second and third fragments leads one of the fragments to be considerably longer than any of the others.
These differences between the two DNA strands are polymorphisms. The word polymorphism means “more than one form.” And the basic idea behind RFLP analysis is that differences in restriction sites will result in restriction fragment length polymorphism. The differences are of two kinds: differences in the number of fragments, and differences in the length of the fragments.
3. RFLPS: Checking Understanding
[qwiz random = “false” qrecord_id=”sciencemusicvideosMeister1961-RFLPs (M17)”] [h]
Restriction Enzymes, Fragments, and Polymorphisms
[i]
[q] Restriction enzymes were first identified in [hangman], where their function is to fight off [hangman].
[c]IGJhY3Rlcmlh[Qq]
[f]IEV4Y2VsbGVudCE=[Qq]
[c]IHZpcnVzZXM=[Qq]
[f]IEdyZWF0IQ==[Qq]
[q] HindIII is a(n) [hangman] enzyme.
[c]IHJlc3RyaWN0aW9u[Qq]
[f]IENvcnJlY3Qh[Qq]
[q] The two yellow boxes below both show pieces of [hangman] that have been cut into restriction [hangman].
[c]IEROQQ==[Qq]
[f]IEdyZWF0IQ==[Qq]
[c]IGZyYWdtZW50cw==[Qq]
[f]IEV4Y2VsbGVudCE=[Qq]
[q] In the diagram below, RFLPs are indicated by the number
[textentry single_char=”true”]
[c]ID I=[Qq]
[f]IEdyZWF0ISBOdW1iZXIgJiM4MjIwOzImIzgyMjE7IGluZGljYXRlcyBkaWZmZXJlbmNlcyDigJQgcG9seW1vcnBoaXNtcyDigJQgaW4gdGhlIGxlbmd0aHMgb2YgdGhlIHJlc3RyaWN0aW9uIGZyYWdtZW50cyBmcm9tIHR3byBkaWZmZXJlbnQgRE5BIHNhbXBsZXMuIFRoZXNlIGRpZmZlcmVuY2VzIGFyZSBrbm93biBhcyBSRkxQcy4=[Qq]
[c]IEVudGVyIHdvcmQ=[Qq]
[f]IFNvcnJ5LCB0aGF0JiM4MjE3O3Mgbm90IGNvcnJlY3Qu[Qq]
[c]ICo=[Qq]
[f]IE5vLiBSRkxQcyBhcmUgdGhlIGZyYWdtZW50cyB0aGF0IHJlc3VsdCB3aGVuIEROQSBpcyBjdXQgd2l0aCByZXN0cmljdGlvbiBlbnp5bWVzLiBXaGF0JiM4MjE3O3MgdGhlIG9ubHkgdGhpbmcgaW4gdGhpcyBkaWFncmFtIHRoYXQgY291bGQgcmVwcmVzZW50IGZyYWdtZW50cyBvZiBhIGxhcmdlciBwaWVjZSBvZiBETkE/[Qq]
[q] In the diagram below, number 1 represents a(n) [hangman] in a [hangman] site
[c]IG11dGF0aW9u[Qq]
[f]IEV4Y2VsbGVudCE=[Qq]
[c]IHJlc3RyaWN0aW9u[Qq]
[f]IE5pY2Ugam9iIQ==[Qq]
[x][restart]
[/qwiz]
4. Gel Electrophoresis
To see these restriction fragment length polymorphisms, we take the restriction fragments and subject them to a treatment called gel electrophoresis.
Electrophoresis is “the movement of charged particles in a fluid or gel under the influence of an electric field.” The process involves the type of apparatus shown below. A gel (5), often made of the polysaccharide agarose (a seaweed extract), is placed in an electrophoresis chamber (3). The chamber is essentially a plastic basin that holds a buffer solution that conducts electricity (6). The chamber has positive (4) and negative (2) electrodes, which are attached to a power supply (7).
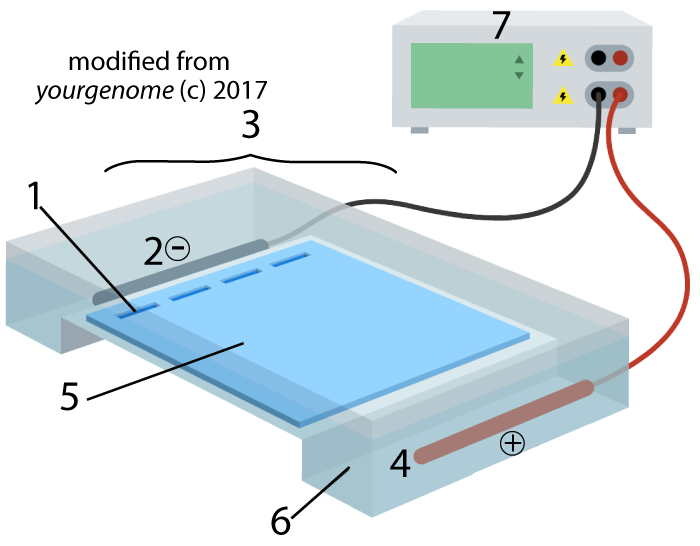
A solution with restriction fragments (also known as a restriction digest) is placed within wells (1), which are indentations in the gel. When you turn the power on, the DNA in the digest will get pushed through the gel, away from the negative electrode (2) and toward the positive electrode (4).
This pushing is related to DNA’s chemistry. DNA’s backbone consists of alternating deoxyribose sugars (the dark blue pentagon with a “D” below) and phosphate groups (the circle with a “P”).
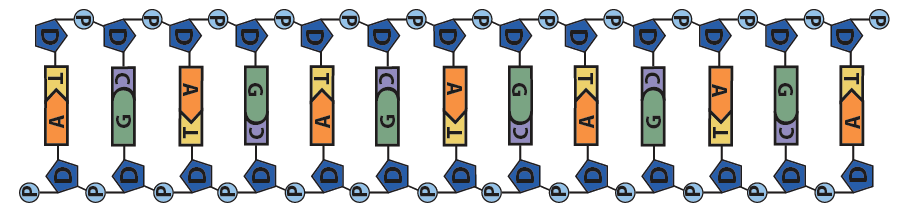
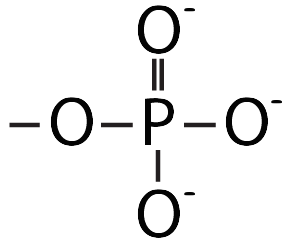
These phosphate groups are negatively charged. As a result, the DNA will be repelled by the negative charge at the negative electrode, and it will be attracted to the positive charge at the positive electrode.
The basic principle of electrophoresis is that small DNA fragments will be impeded by the gel less than large fragments. In other words, large fragments move more slowly than small fragments do, and in a given period, small fragments will move further than large ones.
The image below shows what you would see if you put three different samples of DNA into an electrophoresis chamber. To make sure you’re understanding the explanation above, answer the questions that follow.
[qwiz qrecord_id=”sciencemusicvideosMeister1961-Electrophoresis 1 (M17)”] [h]
Results of electrophoresis
[q] What’s the smallest fragment in the gel shown below?
[textentry single_char=”true”]
[c]ID Y=[Qq]
[f]TmljZS4gJiM4MjIwOzYmIzgyMjE7IHdvdWxkIGhhdmUgdG8gYmUgdGhlIHNtYWxsZXN0IGZyYWdtZW50Lg==[Qq]
[c]IEVudGVyIHdvcmQ=[Qq]
[c]ICo=[Qq]
[f]IE5vLiBJbiBnZWwgZWxlY3Ryb3Bob3Jlc2lzLCB0aGUgc21hbGxlc3QgZnJhZ21lbnQgaXMgZ29pbmcgdG8gbW92ZSB0aGUgZmFzdGVzdCwgYW5kIGluIGEgZ2l2ZW4gcGVyaW9kLCB0aGUgZmFydGhlc3Qu[Qq]
[q] What’s the largest fragment in the gel shown below?
[textentry single_char=”true”]
[c]ID E=[Qq]
[f]RXhjZWxsZW50OiBOdW1iZXIgMSwgd2hpY2ggbW92ZWQgdGhlIHNob3J0ZXN0IGRpc3RhbmNlLCB3b3VsZCBoYXZlIHRoZSBiZSB0aGUgbGFyZ2VzdCBmcmFnbWVudC4=[Qq]
[c]IEVudGVyIHdvcmQ=[Qq]
[c]ICo=[Qq]
[f]IE5vLiBJbiBnZWwgZWxlY3Ryb3Bob3Jlc2lzLCB0aGUgbGFyZ2VzdCBmcmFnbWVudCBpcyBnb2luZyB0byBtb3ZlIHRoZSBzbG93ZXN0LCBhbmQgaW4gYSBnaXZlbiBwZXJpb2QsIHRoZSBzbWFsbGVzdCBkaXN0YW5jZS4=[Qq]
[/qwiz]
5. RFLPs and Plasmid Analysis
What’s shown above gives you the basic idea behind RFLP analysis. In a typical AP Biology or first-year college lab experience, you might take a plasmid or viral DNA, digest it with restriction enzymes, and run the resulting fragments through gel electrophoresis.
 Take a look at the diagram to your right, which represents a plasmid that’s 4000 base pairs long (“4 kb” means four kilobases or 4000 bases). On this plasmid are three restriction sites: one for the restriction enzyme EcoRI, one for HindIII, and one for BamH I. In case you were curious about this, the names of these restriction enzymes include information about the bacteria where the enzyme was first isolated, the specific bacterial strain, and the order of its discovery. EcoRI, for example, was the first restriction enzyme identified in the R strain of E. coli.
What this image is telling you is that the restriction site for HindIII is 500 base pairs (bp) away from the restriction site for EcoRI. If you continue moving clockwise, in another 1500 bp you’ll encounter the restriction site for BamH I. Move clockwise another 2000 bp, and you’ll be back at the restriction site for EcoRI.
Work through the questions that follow to get a sense of how to think about this material. Note that if you’re in a biotechnology course, you’ll be dealing with much more complex material (and should work with the more advanced materials that will be provided by your instructor).
[qwiz qrecord_id=”sciencemusicvideosMeister1961-Restriction Fragments in Plasmids (M17)”]
[h]Restriction Sites and Restriction Fragments in Plasmid DNA
[i]
[q] If the plasmid below is treated with EcoRI and HindIII, the result will be[hangman] restriction fragment(s). The shorter one will be [hangman] bp long, and the longer one will be [hangman] bp long.
[c]IDI=[Qq]
[f]IEdvb2Qh[Qq]
[c]IDUwMA==[Qq]
[f]IEdyZWF0IQ==[Qq]
[c]IDM1MDA=[Qq]
[f]IEV4Y2VsbGVudCE=[Qq]
[q] If the plasmid below is treated with BamH I and HindIII, the result will be [hangman] restriction fragment(s). The shorter one will be [hangman] bp long, and the longer one will be [hangman] bp long.
[c]IDI=[Qq]
[f]IEdyZWF0IQ==[Qq]
[c]IDE1MDA=[Qq]
[f]IENvcnJlY3Qh[Qq]
[c]IDI1MDA=[Qq]
[f]IEV4Y2VsbGVudCE=[Qq]
[q multiple_choice = “true] The image to the left, below, shows a 20 kb plasmid with several restriction sites. The image on the right shows the results of electrophoresis following various combinations of restriction enzymes. Which lane shows the gel that would result if the plasmid were digested with BamH I?
[c]IEHCoCDCoCDCoCA=[Qq][c]IELCoCDC oCDCoMKg[Qq][c]IEM=
Cg==[Qq][f]IE5vLiBUaGUgc2luZ2xlIGxpbmUgaW4gbGFuZSAmIzgyMjA7QSYjODIyMTsgaW5kaWNhdGVzIHRoYXQgb25seSBvbmUgZnJhZ21lbnQgd291bGQgcmVzdWx0IGFuZCB0aGF0IHRoaXMgZnJhZ21lbnQgd291bGQgYmUgMjAga2IgaW4gc2l6ZS4gSWYgeW91IGN1dCB0aGlzIHBsYXNtaWQgd2l0aCBCYW1IMSwgeW91JiM4MjE3O2xsIG1ha2UgMyBjdXRzLiBOb3csIGp1c3QgZmlndXJlIG91dCBob3cgYmlnIGVhY2ggb2YgdGhlIGZyYWdtZW50cyB3b3VsZCBiZSwgYW5kIHlvdSYjODIxNztsbCBoYXZlIHlvdXIgYW5zd2VyLg==[Qq]
[f]IEV4Y2VsbGVudC4gQ3V0dGluZyB0aGlzIHBsYXNtaWQgd2l0aCBCYW1ISSB3aWxsIHJlc3VsdCBpbiB0aHJlZSBmcmFnbWVudHMsIGFuZCB0aGV5JiM4MjE3O2xsIGJlIDExIGtiLCA2IGtiLCBhbmQgMyBLYiBpbiBzaXplLCB3aGljaCBpcyBqdXN0IHdoYXQgaXMgc2hvd24gaW4gdGhpcyBnZWwu[Qq]
[f]IE5vLiBUaGVyZSBhcmUgdGhyZWUgbGluZXMgaW4gbGFuZSBDLCBhbmQgb25lIG9mIHRob3NlIGNvbnNpc3RzIG9mIHR3byBmcmFnbWVudHMuIFRoZSBmaXJzdCBsaW5lIGNvbnNpc3RzIG9mIGEgcmVzdHJpY3Rpb24gZnJhZ21lbnQgdGhhdCYjODIxNztzIDgga2IgbG9uZzsgdGhlIHNlY29uZCBoYXMgYSBmcmFnbWVudCB0aGF0JiM4MjE3O3MgNiBrYiBsb25nLCBhbmQgdGhlIHRoaXJkIGNvbnNpc3RzIG9mIHR3byBmcmFnbWVudHMsIGJvdGggb2Ygd2hpY2ggYXJlIDMga2IuIFdoaWNoIGVuenltZXMgd291bGQgcHJvZHVjZSB0aGF0IHBhdHRlcm4gb2YgZnJhZ21lbnRzPw==[Qq]
[q multiple_choice = “true] The image to the left, below, shows a 20 kb plasmid with several restriction sites. The image on the right shows the results of electrophoresis following various combinations of restriction enzymes. Which lane shows the gel that would result if the plasmid were digested with EcoRI?
[c]IEHCoCDC oCDCoA==[Qq][c]IELCoCDCoCDCoA==[Qq][c]IEM=
Cg==[Qq][f]IE5pY2UgSm9iISBUaGUgc2luZ2xlIGxpbmUgaW4gbGFuZSAmIzgyMjA7QSYjODIyMTsgaW5kaWNhdGVzIHRoYXQgb25seSBvbmUgZnJhZ21lbnQgd291bGQgcmVzdWx0IGFuZCB0aGF0IHRoaXMgZnJhZ21lbnQgd291bGQgYmUgMjAga2IgaW4gc2l6ZS4=[Qq]
[f]IE5vLiBUaGVyZSYjODIxNztzIG9ubHkgb25lIHJlc3RyaWN0aW9uIHNpdGUgcmVjb2duaXplZCBieQ==IEVjbw==IFJJLiBJZiB0aGUgcGxhc21pZCBpcyBjdXQgb3ZlciBhdCB0aGF0IHBvaW50LCBob3cgbWFueSBmcmFnbWVudHMgd291bGQgcmVzdWx0Pw==[Qq]
[f]IE5vLiBUaGVyZSBhcmUgdGhyZWUgbGluZXMgaW4gbGFuZSBDLCBhbmQgb25lIG9mIHRob3NlIGNvbnNpc3RzIG9mIHR3byBmcmFnbWVudHMuIEJ1dCB0aGVyZSYjODIxNztzIG9ubHkgb25lIHJlc3RyaWN0aW9uIHNpdGUgcmVjb2duaXplZCBieQ==IEVjbw==IFJJLiBJZiB0aGUgcGxhc21pZCBpcyBjdXQgb3ZlciBhdCB0aGF0IHBvaW50LCBob3cgbWFueSBmcmFnbWVudHMgd291bGQgcmVzdWx0Pw==[Qq]
[q multiple_choice = “true] The image to the left, below, shows a 20 kb plasmid with several restriction sites. The image on the right shows the results of electrophoresis following various combinations of restriction enzymes. Which lane shows the gel that would result if the plasmid were digested with Bam HI and EcoRI?
[c]IEHCoCDCoCDCoA==[Qq][c]IELCoCDCoCDCoA==[Qq][c]IE M=
Cg==[Qq][f]IE5vLiBUaGUgc2luZ2xlIGxpbmUgaW4gbGFuZSAmIzgyMjA7QSYjODIyMTsgaW5kaWNhdGVzIHRoYXQgdGhlcmUmIzgyMTc7cyBvbmx5IG9uZSBmcmFnbWVudCBhbmQgdGhhdCB0aGlzIGZyYWdtZW50IHdvdWxkIGJlIDIwIGtiIGluIHNpemUuIEhvdyBjb3VsZCB0aGF0IG9jY3VyIGlmIGJvdGggQmFtIEhJIA==YW5kIA==[Qq]Eco R I were used to digest the plasmid?
[f]IE5vLiBMYW5lIEIgaW5kaWNhdGVzIG9uZSBmcmFnbWVudCBvZiAxMSBrYiwgYSBzZWNvbmQgb2YgNiBrYiwgYW5kIGEgM3JkIG9mIDMga2Iu[Qq]
[f]IEV4Y2VsbGVudC4gVGhlcmUgYXJlIHRocmVlIGxpbmVzIGluIGxhbmUgQywgYW5kIG9uZSBvZiB0aG9zZSBjb25zaXN0cyBvZiB0d28gZnJhZ21lbnRzLiBUaGF0JiM4MjE3O3MgZXhhY3RseSB3aGF0IHlvdSYjODIxNztkIGV4cGVjdCBpZiBib3RowqA=QmFtIEhJIA==YW5kIA==[Qq]Eco R I were used to digest the plasmid.
[/qwiz]
6. VNTRs and Human DNA Profiling
An elaboration on the techniques described above led to the first profiles of human DNA in the 1980s. The technique was developed by Sir Alec Jeffreys in 1984 at the University of Leicester in England. Jeffreys was doing research on the structure of the gene for myoglobin, an oxygen-storing protein in muscle tissue. Jeffreys found that within the myoglobin gene, and elsewhere within the human genome, there were short repeated nucleotide sequences. The number of repeats varied. These nucleotide sequences did not code for protein, and such DNA is often called “junk DNA” (though that junk might make up 99% of our genome, and its role is probably more significant than the term “junk” would indicate).
The repeated sequences that Jeffreys found are known as Variable Number Tandem Repeats, or VNTRs, and the name describes exactly what they are. These are repeated strings of nucleotide bases, between 10 and 80 bases in length, with up to 30 repeats, one right after the next (which is why they’re “tandem:” think of a tandem bicycle, the kind with two seats, one behind the other).
These VNTRs are on specific locations on a chromosome, as shown below.
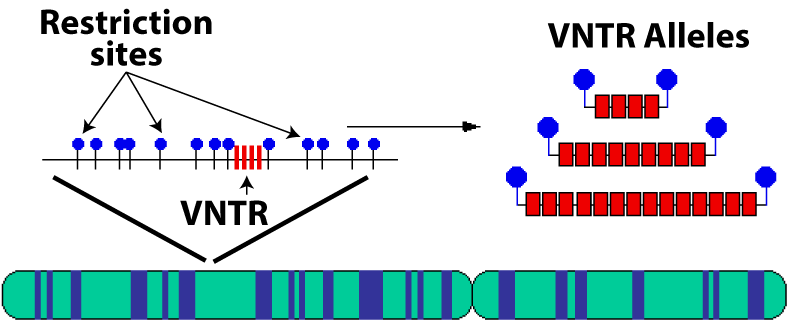
The spot in the chromosome with the four red bars is the VNTR locus (location). The VNTR above shown has four repeats, but, as indicated on the right, there are other possibilities, each with a different number of repeats (for example, 9 or 14).
These alternative numbers of repeats are called alleles, the same term that’s used to refer to alternative forms of genes.
If we could read the nucleotides within a VNTR, we might see what’s below. Note that for clarity, only one strand of DNA is shown.
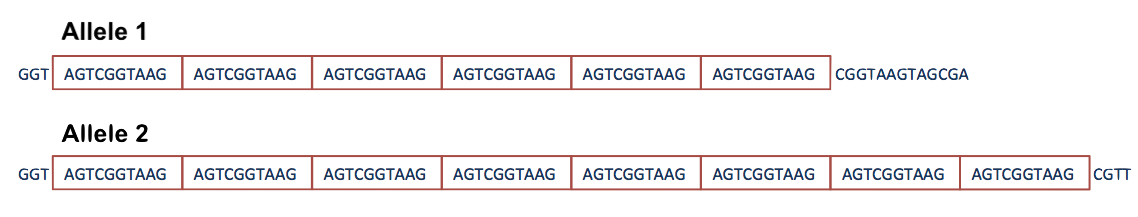
In this case, the first allele has 6 repeats, and the second has 8.
When we inherit DNA from our parents, we’ll also inherit their VNTRs.
 .
.
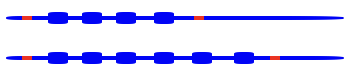
The image above represents two homologous chromosomes, one inherited from the mother, and one from the father. On each chromosome is a VNTR sequence, one with four repeats, one with six. Restriction sites (in red) flank the VNTRs.
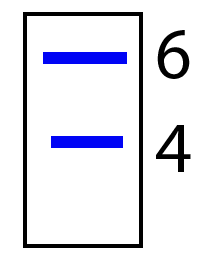 If we were to cut out these VNTRs with restriction enzymes, and then run the DNA through gel electrophoresis, we’d get two fragments: one longer and one shorter, like what’s shown on the right. Note that the gel is shown without a well, and the VNTR with 6 repeats is shown next to the number 6, and the VNTR with 4 repeats is shown next to the number 4.
DNA is colorless, and to see the VNTR DNA, we’d apply a probe. The probe is a sequence of DNA made with radioactive atoms, and which is complementary to the VNTR sequence. For example, if the VNTR sequence is AGTCGGTAAG, then our probe would be TCAGCCATTC.
The overall technique is called Southern blotting, and it’s shown below.
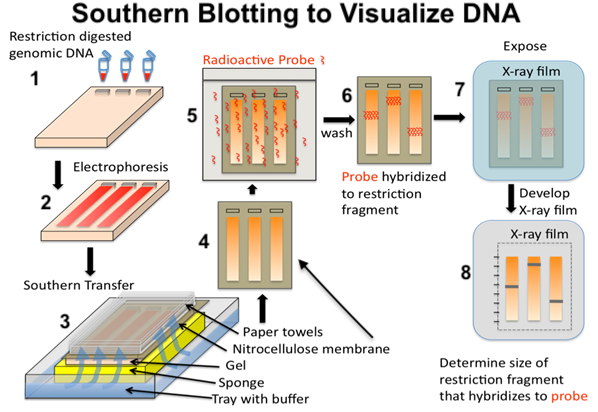
All that you need to know is that after electrophoresis (step 2), the DNA is transferred to a membrane made of a transparent material called nitrocellulose (steps 3 and 4). The radioactive probe is applied in steps 5 and 6. Putting the nitrocellulose film next to an X-ray film, and the radioactive probe will generate the image shown in 8.
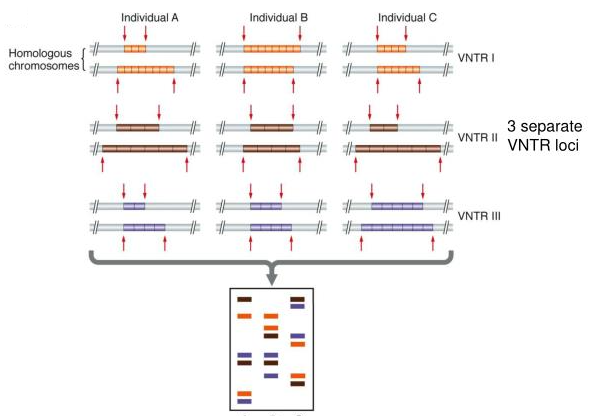
That’s essentially it. If you use a probe to target multiple instances of VNTRs, you can create a pattern that’s as unique as a fingerprint. Here’s an example of a profile that can be created with three separate VNTR loci. Note that the position of the VNTR on the gel is a function of the number of repeats and the length of the repeats.
So, you can see that by using VNTRs, you can create a unique DNA pattern. The more VNTRs you use, the more unique that pattern will be. Here’s Alec Jeffreys himself, with an early VNTR-based DNA fingerprint. When you get to the number of VNTRs shown below, you’ve established a unique pattern: unique enough to hold up in court.
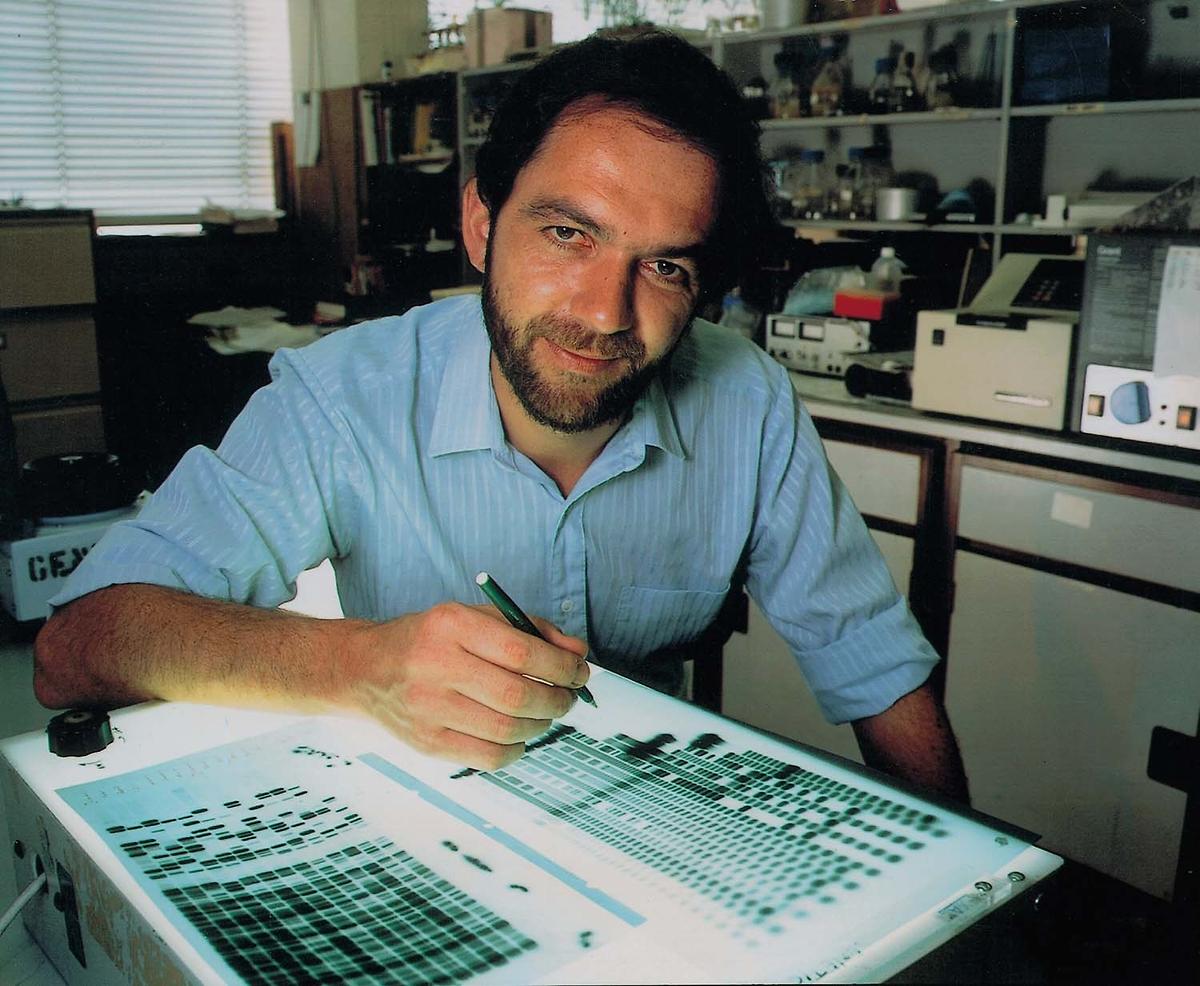
The University of Leicester. Source: https://www.nlm.nih.gov/visibleproofs/galleries/cases/jeffreys.html
The first time that VNTRs were used in a legal context involved a question of disputed parenthood. This occurred in England, in 1985. British Authorities claimed that Andrew Sarbah, a British citizen returning to England after visiting his father in Ghana, was not who he claimed to be. They claimed, rather, that he was someone else trying to enter the country on a forged passport. The lawyer for Andrew’s mother, Christiana Sarbah, contacted Jeffreys and asked him if he could use DNA fingerprinting to prove the mother-son relationship between Christiana and Andrew. Jeffreys took up the challenge: he created DNA fingerprints for Christiana and three of her undisputed children.
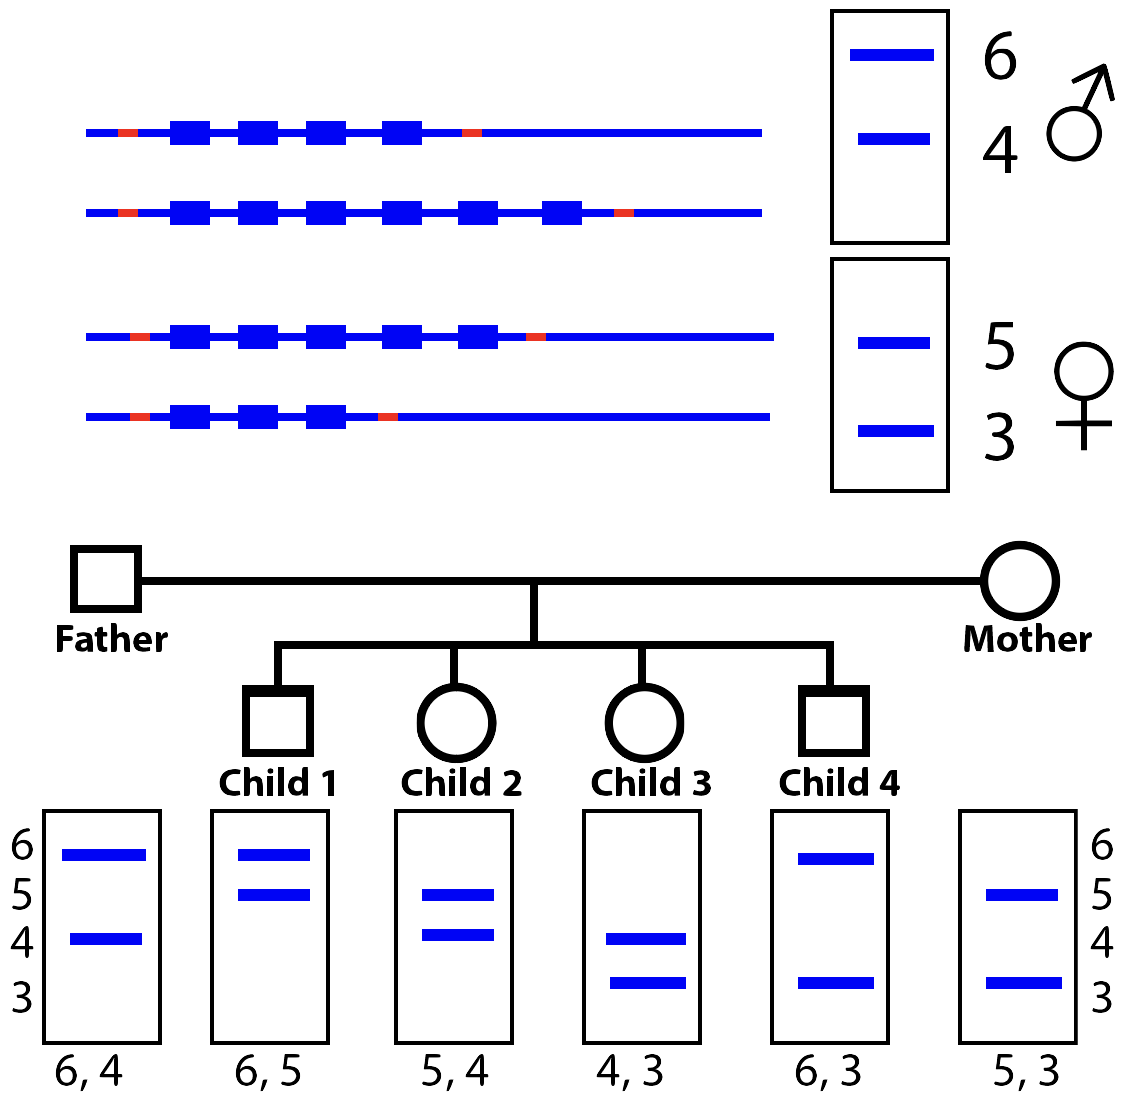
To simplify the analysis, look at the diagram on the left. The mother (Christiana) has VNTR bands at positions 5 and 3, while her husband has bands at positions 6 and 4. During sexual reproduction, parents pass on one of their two chromosomes to their offspring. So, to show the relationship between the mother and the children, each child has to have a RFLP band at position 5 or 3 (but not both). And that’s exactly what Jeffreys was able to establish between Andrew and Christiana: a 50% match in their DNA fingerprint pattern.
7. From VNTRs to STRs
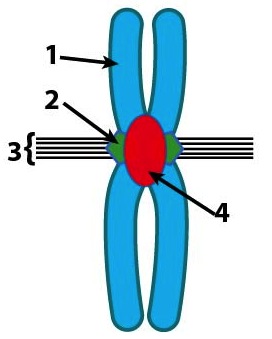 In recent decades, DNA fingerprinting using VNTRs has been supplanted by methods that use short tandem repeats (STRs). STRs (pronounced “stirs”) are usually 2 to 6 base pairs long, and they’re found close to the centromere, a structural part of a chromosome that connects sister chromatids when chromosomes are being duplicated during the cell cycle. In the diagram to the left, “4” is the centromere (but remember that it’s made out of DNA and protein, just like the rest of the chromosome is).
Examples of STRs include the two nucleotide sequence CACACACA, the three-nucleotide sequence GCCGCCGCC, and the four nucleotide sequence AATGAATG. These small repeats are also called microsatellites.
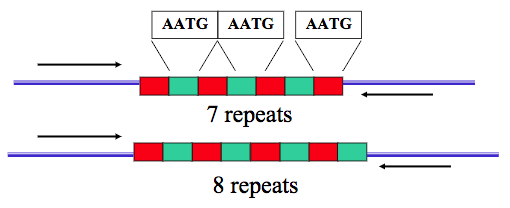
As with any other allele, individuals can be homozygotic, with both of the STRs on a homologous chromosome being the same, or heterozygotic, as shown above.
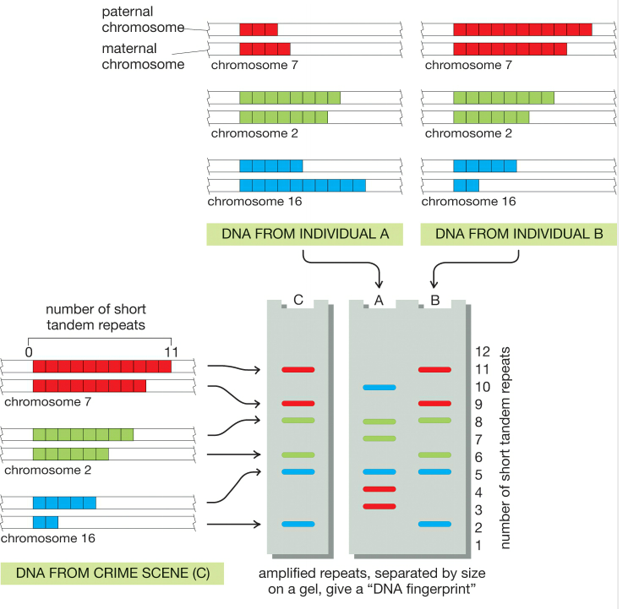
Understanding how STRs are used to establish identity involves the same logic that we used above to explain VNTR-based DNA fingerprints. In the example to the right, the DNA on the left is from a crime scene. STRs from three chromosome pairs (7, 2, and 16) are amplified using PCR and then separated using gel electrophoresis. In the DNA fingerprint marked as “C”, you can see the pattern that emerges.
Now find the label that says “DNA from Individual A.” Above the label, you see a diagram indicating the number of STR repeats that this individual has on chromosomes 7, 2, and 16. Immediately below, you see their DNA fingerprint. Because of the different number of STRs, the fragments produced have a different size than the fragments from the crime scene, and the DNA fingerprint is different. By contrast, individual B’s STR repeats match those from the crime scene, resulting in an identical DNA fingerprint to that recovered from the crime scene. That doesn’t prove, in and of itself, that they committed the crime, but their defense attorney will have to explain why their DNA was at the crime scene.
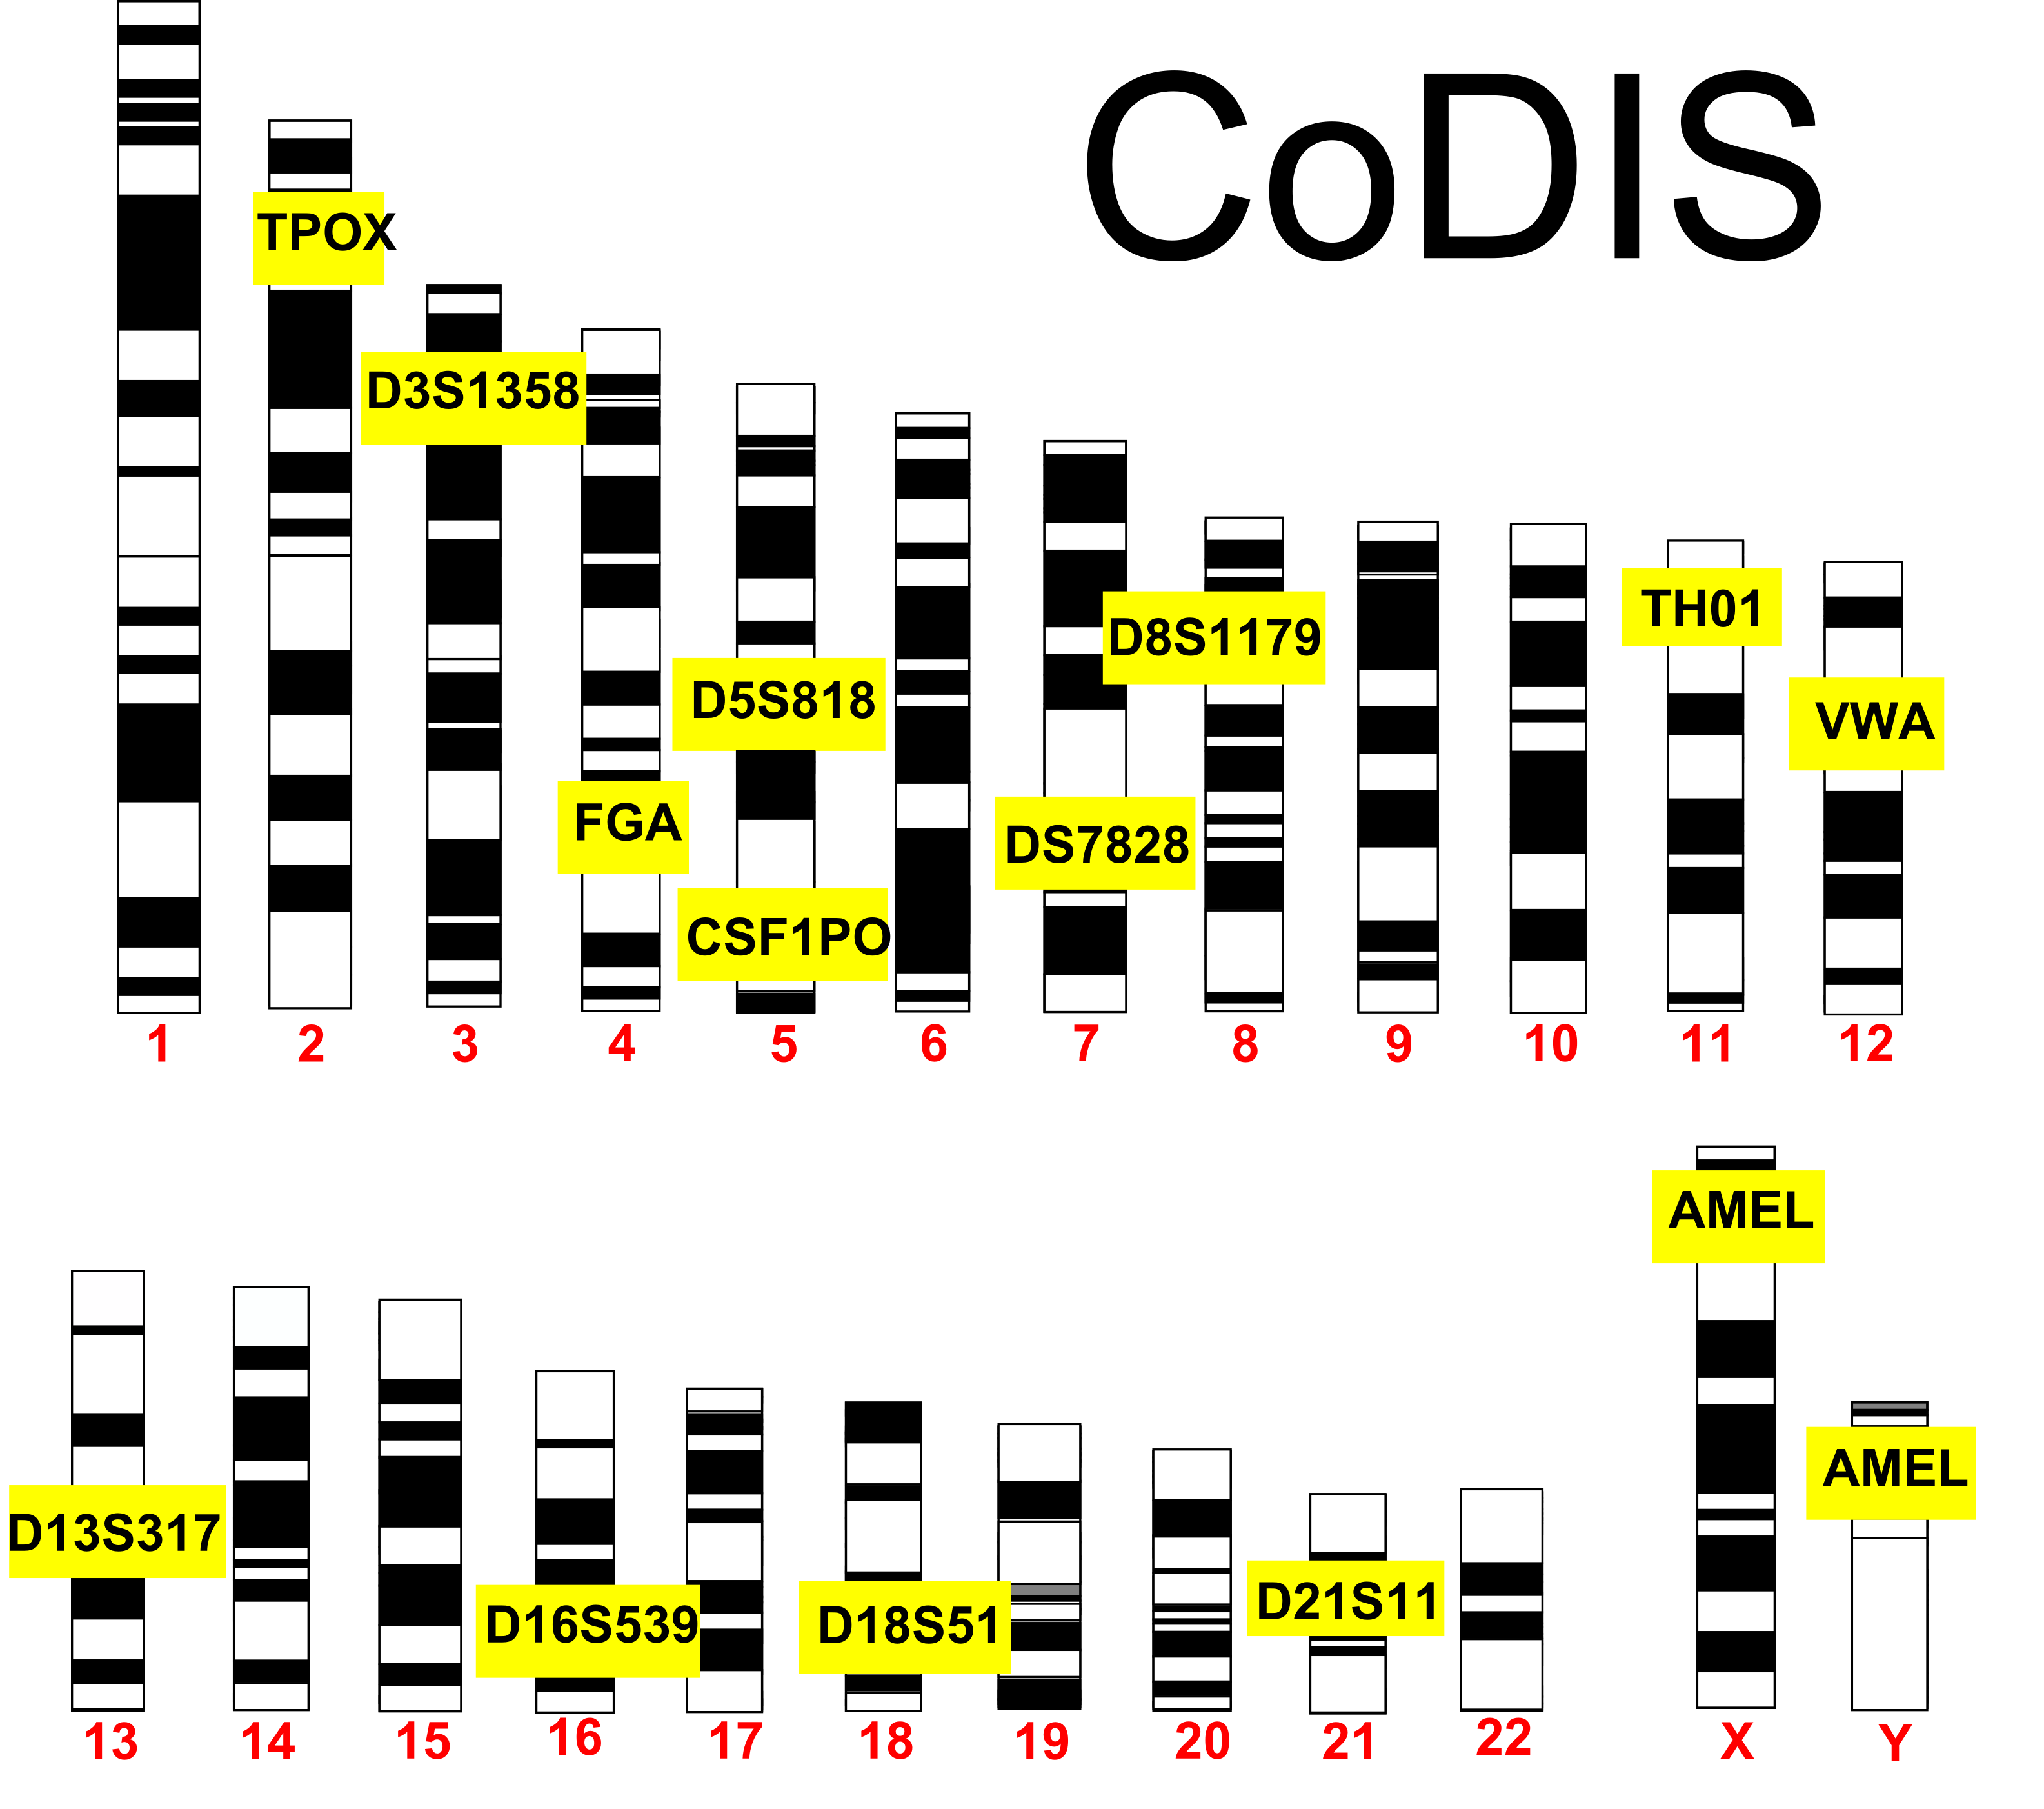 Using STRs, the FBI has developed a system called CODIS (Combined DNA Index System). CODIS is a standardized DNA profiling method and database that’s available to law enforcement agencies, enabling them to match the DNA of suspects, victims, and convicted offenders.
The first version of CODIS used 13 STR loci to create a DNA profile. For example, find “TPOX” on chromosome 2. It’s a STR with the sequence AATG, and it repeats from 6 to 13 times (meaning that there are 8 alleles). Now find “D18S51” on chromosome 18. Its sequence is AGAA, and it repeats between 7 and 39 times (for 32 alleles). By using all 13 loci, it becomes statistically impossible that any two different people (other than identical twins) would have the same profile.
Here’s an example of a DNA profile that DNA analyst Bob Blackett made using his own DNA, using the CODIS loci (note: this passage is taken verbatim from the Biology Project at the University of Arizona). In the context of the table below, “genotype” means the number of STR repeats for this individual at each locus.
As part of his training and proficiency testing for DNA Profile analysis of STR (Short Tandem Repeat) Polymorphisms, Forensic Scientist and DNA Analyst Bob Blackett created a DNA profile on his own DNA. Here is Bob’s DNA Profile for the 13 core Genetic Loci of the United States national database, CODIS (Combined DNA Index System):
| Locus | D3S1358 | vWA | FGA | D8S1179 | D21S11 | D18S51 | D5S818 |
| Genotype | 15, 18 | 16, 16 | 19, 24 | 12, 13 | 29, 31 | 12, 13 | 11, 13 |
| Frequency | 8.2% | 4.4% | 1.7% | 9.9% | 2.3% | 4.3% | 13% |
| Locus | D13S317 | D7S820 | D16S539 | THO1 | TPOX | CSF1PO | AMEL |
| Genotype | 11, 11 | 10, 10 | 11, 11 | 9, 9.3 | 8, 8 | 11, 11 | X Y |
| Frequency | 1.2% | 6.3% | 9.5% | 9.6% | 3.52% | 7.2% | (Male) |
For each genetic locus, Bob has determined his “genotype”, and the expected frequency of his genotype at each locus in a representative population sample. For example, at the genetic locus known as “D3S1358”, Bob has the genotype of “15, 18”. This genotype is shared by about 8.2% of the population. By combining the frequency information for all 13 CODIS loci, Bob can calculate that the frequency of his profile would be 1 in 7.7 quadrillion Caucasians (1 in 7.7 times 10 to the 15th power!).
8. Checking Understanding: DNA Fingerprinting
Before taking the quiz below, here’s a final thought about DNA fingerprinting. While it might seem like the main use of DNA profiling is as a method to convict criminals, it’s also been used to exonerate people who were wrongly convicted of crimes, often after these people had served years behind bars. The Innocence Project has freed more than 350 wrongly convicted people by using DNA. That includes 20 individuals who were on death row. Click the preceding link to learn more about this group’s work.
[qwiz qrecord_id=”sciencemusicvideosMeister1961-DNA Fingerprinting (M17)”] [h]
DNA Fingerprinting
[i]
[q] The 10 – 30 nucleotide sequences used by Alec Jeffreys to create the first human DNA profiles are known as [hangman] number [hangman] repeats.
[c]IHZhcmlhYmxl[Qq]
[f]IEdvb2Qh[Qq]
[c]IHRhbmRlbQ==[Qq]
[f]IENvcnJlY3Qh[Qq]
[q] In the diagram below, the upward-facing arrow indicates a VNTR with four repeats. The VNTR sequences with 9 or 14 repeats represent other possible[hangman]
[c]IGFsbGVsZXM=[Qq]
[f]IEV4Y2VsbGVudCE=[Qq]
[q] In the diagram below, the upward-facing arrow indicates a VNTR with four repeats. Number 3 is the VNTR[hangman]
[c]IGxvY3Vz[Qq]
[f]IEdyZWF0IQ==[Qq]
[q] In the diagram below, the upward-facing arrow indicates a VNTR with four repeats. The lines with blue dots represent [hangman] sites.
[c]IHJlc3RyaWN0aW9u[Qq]
[f]IEdvb2Qh[Qq]
[q multiple_choice=”true”] Which of the following sequences would not be found within a STR?
[c]IENBQ0FDQUNBQ0E=[Qq]
[f]IE5vLiBUaGlzIHNob3dzIGEgcmVwZWF0IG9mIHRoZSB0d28gbnVjbGVvdGlkZSBzZXF1ZW5jZSAmIzgyMjA7Q0EsJiM4MjIxOyBhbmQgY291bGQgYmUgZm91bmQgd2l0aGluIGEgU1RSLiBUaGluayBhYm91dCB3aGF0ICYjODIyMDtTVFImIzgyMjE7IHN0YW5kcyBmb3IsIGFuZCB5b3UmIzgyMTc7bGwgaGF2ZSB0aGUgYW5zd2VyLg==[Qq]
[c]IEFHVENH R1RBQUc=[Qq]
[f]IENvcnJlY3QuICYjODIyMDtTVFImIzgyMjE7IHN0YW5kcyBmb3Igc2hvcnQgdGFuZGVtIHJlcGVhdCwgYW5kIHRoZSByZXBlYXRzIGFyZSBsZXNzIHRoYW4gc2l4IG51Y2xlb3RpZGVzIGxvbmcu[Qq]
[c]IEFBVEdBQVRHQUFURw==[Qq]
[f]IE5vLiBUaGlzIHNob3dzIGEgcmVwZWF0IG9mIHRoZSBmb3VyIG51Y2xlb3RpZGUgc2VxdWVuY2UgJiM4MjIwO0FBVEcsJiM4MjIxOyBhbmQgY291bGQgYmUgZm91bmQgd2l0aGluIGEgU1RSLiBUaGluayBhYm91dCB3aGF0ICYjODIyMDtTVFImIzgyMjE7IHN0YW5kcyBmb3IsIGFuZCB5b3UmIzgyMTc7bGwgaGF2ZSB0aGUgYW5zd2VyLg==[Qq]
[q labels = “top”]
[l]VNTR
[f*] Good!
[fx] No, that’s not correct. Please try again.
[l]STR
[f*] Great!
[fx] No, that’s not correct. Please try again.
[q labels = “top”]Put the following steps of VNTR DNA analysis in the correct order
____ Digest a sample of DNA with restriction enzymes
__ _ Expose the membrane to X-ray film
____ Transfer the DNA from the gel to a transparent membrane
____ Use electrophoresis to separate the DNA fragments by size
____ Use a radioactive probe that binds with the VNTRs
[l]1
[f*] Great!
[fx] No. Please try again.
[l]2
[f*] Correct!
[fx] No. Please try again.
[l]3
[f*] Good!
[fx] No, that’s not correct. Please try again.
[l]4
[f*] Correct!
[fx] No, that’s not correct. Please try again.
[l]5
[f*] Great!
[fx] No, that’s not correct. Please try again.
[q] When using DNA analysis to link a suspect to a crime scene, you want a[hangman]percent match between the crime scene DNA and a suspect. In a paternity case, you want a [hangman]percent match.
[c]IDEwMA==[Qq]
[f]IEV4Y2VsbGVudCE=[Qq]
[c]IDUw[Qq]
[f]IENvcnJlY3Qh[Qq]
[q] In the diagram below, which letter represents restriction enzymes?
[textentry single_char=”true”]
[c]IG M=[Qq]
[f]IEdvb2QhICYjODIyMDtDJiM4MjIxOyByZXByZXNlbnRzIHJlc3RyaWN0aW9uIGVuenltZXMuwqA=[Qq]
[c]IEVudGVyIHdvcmQ=[Qq]
[f]IE5vLg==[Qq]
[c]ICo=[Qq]
[f]IE5vLiBIZXJlJiM4MjE3O3MgYSBoaW50OiByZXN0cmljdGlvbiBlbnp5bWVzIGN1dCBETkEgaW50byBmcmFnbWVudHMu[Qq]
[q] In the diagram below, which letter represents restriction fragments?
[textentry single_char=”true”]
[c]IG Q=[Qq]
[f]IENvcnJlY3QhICYjODIyMDtEJiM4MjIxOyByZXByZXNlbnRzIHJlc3RyaWN0aW9uIGZyYWdtZW50cy4=[Qq]
[c]IEVudGVyIHdvcmQ=[Qq]
[f]IFNvcnJ5LCB0aGF0JiM4MjE3O3Mgbm90IGNvcnJlY3Qu[Qq]
[c]ICo=[Qq]
[f]IE5vLiBIZXJlJiM4MjE3O3MgYSBoaW50OiByZXN0cmljdGlvbiBmcmFnbWVudHMgYXJlIHBpZWNlcyBvZiBETkEgdGhhdCBoYXZlIGJlZW4gY3V0IGFwYXJ0IGJ5IHJlc3RyaWN0aW9uIGVuenltZXMu[Qq]
[q] In the diagram below, which letter represents the “gel” in gel electrophoresis?
[textentry single_char=”true”]
[c]IG U=[Qq]
[f]IEdyZWF0ISBMZXR0ZXIgJiM4MjIwO2UmIzgyMjE7IHJlcHJlc2VudHMgdGhlIGdlbC7CoA==[Qq]
[c]IEVudGVyIHdvcmQ=[Qq]
[f]IE5vLCB0aGF0JiM4MjE3O3Mgbm90IGNvcnJlY3Qu[Qq]
[c]ICo=[Qq]
[f]IE5vLiBIZXJlJiM4MjE3O3MgYSBoaW50LiBHZWwgZWxlY3Ryb3Bob3Jlc2lzIHNlcGFyYXRlcyBETkEgZnJhZ21lbnRzIGJ5IHNpemUu[Qq]
[q] In the diagram below, which letter represents the position of the smallest DNA fragments from electrophoresis?
[textentry single_char=”true”]
[c]IG c=[Qq]
[f]IEV4Y2VsbGVudCEgVGhlIHNtYWxsZXN0IGZyYWdtZW50cyB3b3VsZCBtb3ZlIHRoZSBmdXJ0aGVzdCwgYW5kIHdvdWxkIHdpbmQgdXAgYXQgJiM4MjIwO2cuJiM4MjIxOw==[Qq]
[c]IEVudGVyIHdvcmQ=[Qq]
[f]IFNvcnJ5LCB0aGF0JiM4MjE3O3Mgbm90IGNvcnJlY3Qu[Qq]
[c]ICo=[Qq]
[f]IE5vLiBIZXJlJiM4MjE3O3MgYSBoaW50LiBEdXJpbmcgZWxlY3Ryb3Bob3Jlc2lzLCB0aGUgc21hbGxlc3QgZnJhZ21lbnRzIG1vdmUgdGhlIGZ1cnRoZXN0Lg==[Qq]
[q] In the diagram below, which letter represents the exposure of DNA fragments to a probe?
[textentry single_char=”true”]
[c]IG k=[Qq]
[f]IENvcnJlY3QhIFRoZSBsZXR0ZXIgJiM4MjIwO2kmIzgyMjE7IHJlcHJlc2VudHMgdGhlIGV4cG9zdXJlIG9mIGZyYWdtZW50cyB0byBhIHByb2JlLsKg[Qq]
[c]IEVudGVyIHdvcmQ=[Qq]
[f]IFNvcnJ5LCB0aGF0JiM4MjE3O3Mgbm90IGNvcnJlY3Qu[Qq]
[c]ICo=[Qq]
[f]IE5vLiBIZXJlJiM4MjE3O3MgYSBoaW50LiBUaGUgcHJvYmUgaXMgYSBzbWFsbCBwaWVjZSBvZiBETkEgdGhhdCYjODIxNztzIGNvbXBsZW1lbnRhcnkgdG8gYSBzaG9ydCBzZXF1ZW5jZSBvbiBzb21lIG9mIHRoZSByZXN0cmljdGlvbiBmcmFnbWVudHMu[Qq]
[q multiple_choice=”true”] When subject to electrophoresis, individual 1’s DNA will be found in
[c]IExhbmUgQQ==[Qq]
[f]Tm8uIEhlcmUmIzgyMTc7cyBob3cgdG8gdGhpbmsgYWJvdXQgdGhpcy4gQm90aCBvZiBpbmRpdmlkdWFsIDEmIzgyMTc7cyBTVFJzIGFyZSAxMiByZXBlYXRzIGxvbmcuIFdoZW4gc3ViamVjdCB0byBnZWwgZWxlY3Ryb3Bob3Jlc2lzLCB0aGV5JiM4MjE3O3JlIGdvaW5nIHRvIGJlIHNvcnRlZCBieSBzaXplLiBXaGVuIHRoZXkmIzgyMTc7cmUgc29ydGVkIGJ5IHNpemUsIHdpbGwgdGhleSB3aW5kIHVwIGluIHRoZSBzYW1lIHBvc2l0aW9uIG9yIGRpZmZlcmVudCBwb3NpdGlvbnM/[Qq]
[c]IExhbm UgQg==[Qq]
[f]RXhjZWxsZW50LiBJbmRpdmlkdWFsIDEgaXMgYSBob21venlnb3RlOiBib3RoIFNUUiBhbGxlbGVzIGFyZSB0aGUgc2FtZS4gV2hlbiBzb3J0ZWQgYnkgc2l6ZSwgYm90aCBmcmFnbWVudHMgd2lsbCBtaWdyYXRlIHRvIHRoZSBzYW1lIHBvc2l0aW9uLCBhbmQgdGhlcmUgd2lsbCBvbmx5IGJlIG9uZSBiYW5kIG9uIHRoZSBnZWwu[Qq]
[/qwiz]
Link to
- DNA Sequencing (the next tutorial in this module)
- Genetic Engineering Main Menu