Phylogeny and Classification Student Learning Guide
1. Phylogeny shows evolution’s branching pattern
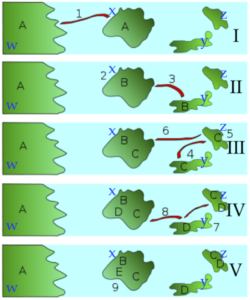 Imagine the scenario that’s depicted in the series of diagrams to the left.
The scenario starts with one ancestral songbird species. This is species “A,” which lives on continent “w.” In a storm (indicated by “1”), a small population of individuals from species “A” is blown to island “x.”
Island “x” is beyond “A’s” normal flying range. As a result, this new island population is cut off from its parent population. In the subsequent years, a series of events involving migration, genetic drift, and adaptation by natural selection to the differing environments on each island result in repeated instances of speciation. At the end, four new species — B, C, D, and E — evolve on these islands, while “A” continues to exist on the mainland.
Such a scenario is thought to explain the evolution of the finches on the Galapagos Islands, an island chain located about 1000 kilometers off the Pacific coast of Ecuador, in South America. Six of the Galapagos finch species are shown below, along with its proposed common ancestor.
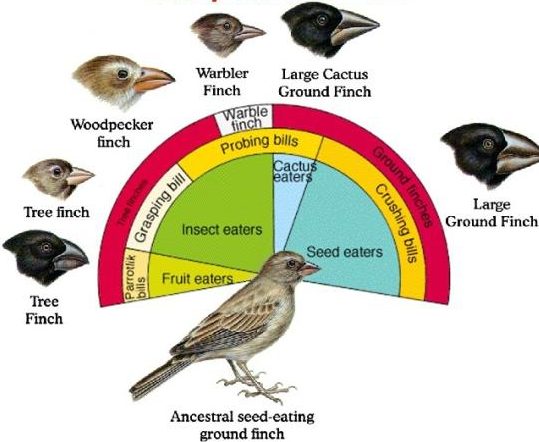
The diagram above tells a story of adaptive radiation, a process by which an ancestral species diversifies into an array of descendant species. In the case of the Galapagos finches, each descendant species has evolved a different beak phenotype (as well as other differences). Each species is adapted to a specific ecological niche.
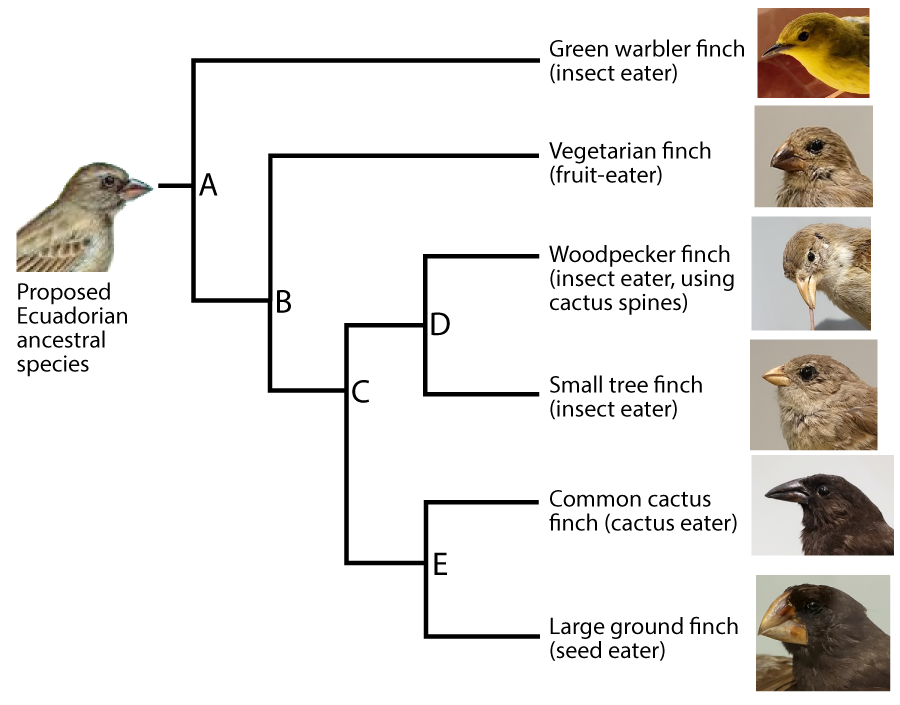
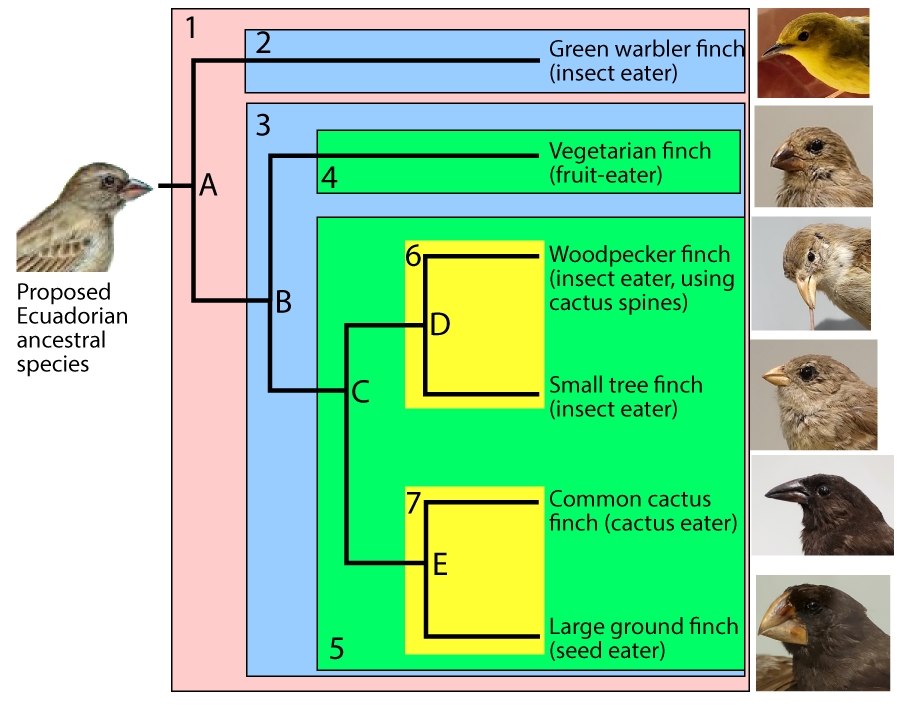
Phylogeny is the study of evolutionary history and relationships among individuals or populations. To represent these relationships, biologists construct phylogenetic trees. The one that follows shows the phylogeny of six of the Galapagos species (though not the same ones as those shown directly above).
In this diagram, “A” represents the common ancestor of all of the species shown in on the right side of the diagram. A group that consists of a common ancestor and all of its descendants is called a clade. A clade can be a group of species, a single species, or a population within a species.
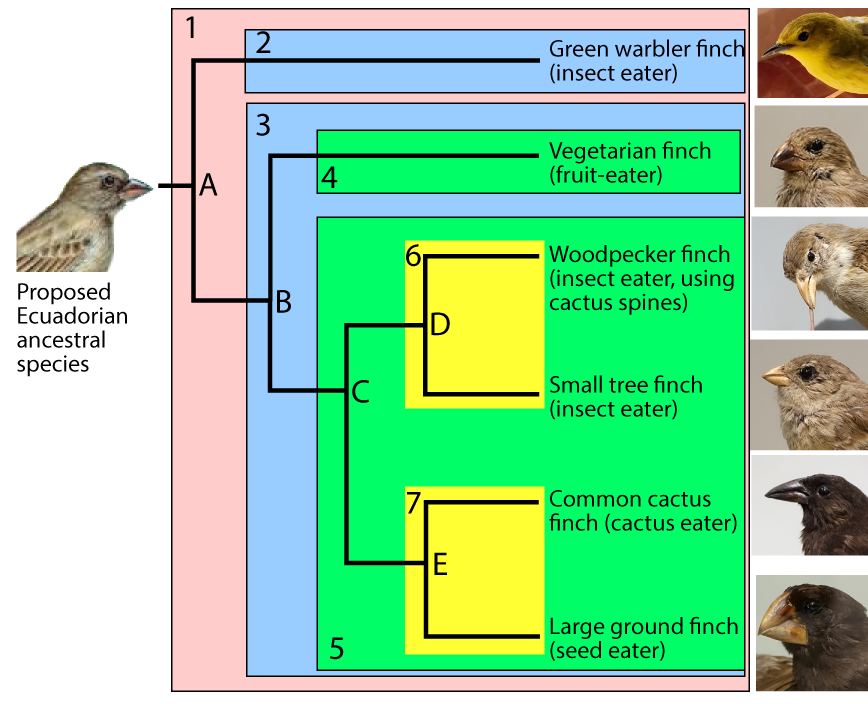
To make the subsequent history clearer, I’ve added shading to the diagram (see below). The clade that’s descended from species “A” is numbered as clade “1.”
For any clade that consists of more than one species, the common ancestors are located at nodes. The nodes are labeled “A” through “E.” Because nodes are where speciation events occur, they’re also called branch points.
A speciation event at node “A” created two new clades, “2” and “3.” A second speciation event at node “B” produced two more clades (“4” and “5.”). Another speciation event at “C” produced clades “6” and “7.” Speciations at nodes “D” and “E” produced additional clades, each consisting of a single species.
A phylogenetic tree shows the branching pattern typical of evolution. It also indicates change within a single line of descent, or a lineage. Imagine that you could examine allele and phenotype frequencies in the lineage leading up to the Green Warbler Finch. The population at “p” would be different from that at “q,” which in turn would be different from “r.”
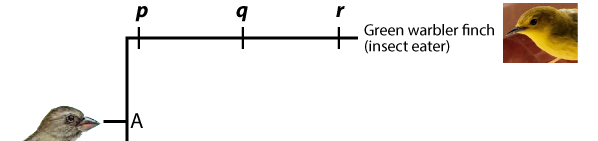
Whatever is at the tip of the branches of a phylogenetic tree is called a terminal taxon. In the example immediately above, the Green Warbler is a terminal taxon. A taxon is any named group of organisms (or other evolving entities).
One goal of classification is to create taxa (the plural of taxon) that are clades. And with that in mind, let’s continue by looking at how organisms are classified and named. But before that, take the following quiz.
2. Phylogeny Introduction: Checking Understanding
[qwiz qrecord_id=”sciencemusicvideosMeister1961-Phylogeny-1-Introduction”]
[h] Phylogeny introduction: checking understanding
[i]
[q] Arrays of related species like the Galapagos finches arise through [hangman] [hangman]
[c]IGFkYXB0aXZl[Qq]
[f]IENvcnJlY3Qh[Qq]
[c]IHJhZGlhdGlvbg==[Qq]
[f]IEV4Y2VsbGVudCE=[Qq]
[q] The study of evolutionary history is called [hangman]
[c]IHBoeWxvZ2VueQ==[Qq]
[f]IEdvb2Qh[Qq]
[q] A group that consists of a common ancestor and its descendants is called a [hangman]
[c]IGNsYWRl[Qq]
[f]IENvcnJlY3Qh[Qq]
[q] In the diagram below, the shaded rectangles represent [hangman]. The letters represent common [hangman]. They’re also called [hangman]. And because they represent points where one lineage splits into two, they’re also called [hangman] points.
[c]IGNsYWRlcw==[Qq]
[f]IENvcnJlY3Qh[Qq]
[c]IGFuY2VzdG9ycw==[Qq]
[f]IENvcnJlY3Qh[Qq]
[c]IG5vZGVz[Qq]
[f]IEdvb2Qh[Qq]
[c]IGJyYW5jaA==[Qq]
[f]IEdyZWF0IQ==[Qq]
[q] The name for the process that occurs at the nodes in a phylogenetic tree is [hangman].
[c]IHNwZWNpYXRpb24=[Qq]
[f]IENvcnJlY3Qh[Qq]
[q] The ancestor of clade 6 is
[textentry single_char=”true”]
[c]IE Q=[Qq]
[f]IE5pY2Ugam9iISAmIzgyMjA7RCYjODIyMTsgaXMgdGhlIGNvbW1vbiBhbmNlc3RvciBvZiBjbGFkZSA2Lg==[Qq]
[c]IEVudGVyIHdvcmQ=[Qq]
[c]ICo=[Qq]
[f]IE5vLiBIZXJlJiM4MjE3O3MgYSBoaW50OiBUaGUgY29tbW9uIGFuY2VzdG9yIG9mIGNsYWRlIDcgaXMgJiM4MjIwO0UuJiM4MjIxOyBJZiB0aGF0JiM4MjE3O3MgdGhlIGNhc2UsIHRoZW4gd2hhdCYjODIxNztzIHRoZSBjb21tb24gYW5jZXN0b3Igb2YgY2xhZGUgNj8=[Qq]
[q] “B” is the common ancestor of which clade?
[textentry single_char=”true”]
[c]ID M=[Qq]
[f]IFdheSB0byBnbyEgJiM4MjIwO0ImIzgyMjE7IGlzIHRoZSBjb21tb24gYW5jZXN0b3Igb2YgY2xhZGUgMy4=[Qq]
[c]IEVudGVyIHdvcmQ=[Qq]
[c]ICo=[Qq]
[f]IE5vLiBIZXJlJiM4MjE3O3MgYSBoaW50OiAmIzgyMjA7QyYjODIyMTsgaXMgdGhlIGNvbW1vbiBhbmNlc3RvciBvZiBjbGFkZSA1LiBJZiB0aGF0JiM4MjE3O3MgdGhlIGNhc2UsIHRoZW4gJiM4MjIwO0ImIzgyMjE7IGlzIHRoZSBjb21tb24gYW5jZXN0b3Igb2Ygd2hpY2ggY2xhZGU/[Qq]
[q]A single line of descent is known as a [hangman]. In a phylogenetic tree, you’d see this line of descent as one [hangman] on the tree.
[c]bGluZWFnZQ==[Qq]
[c]YnJhbmNo[Qq]
[/qwiz]
3. Naming and Classifying Species
3a. Binomial nomenclature, or scientific naming
The practice of naming species or varieties and organizing them into categories has probably been going on, at some level, for our entire history as a species. During the mid-1700s, a Swedish botanist, zoologist, and physician named Carl Linnaeus developed the modern system of taxonomy: the “science dealing with the description, identification, naming, and classification of organisms” (Dictionary.com).
Let’s begin with naming. A species is a group of organisms that can successfully interbreed to produce fertile offspring, and which is isolated from other such groups. In the Linnaean system, every species has a two part name. The first part of the name identifies a genus. For example, the genus to which humans belong is Homo. We’re the only species within this genus, which we share with a few other extinct species. The second part of the name is the specific epithet. Ours is “sapiens.” That makes our species name Homo sapiens, which in Latin means “wise man.”
In the Linnaean system,
- species names are in Latin, and italicized.
- The genus begins with a capital letter,
- the specific epithet begins with a lower-case letter.
Here are a few examples of familiar species and genera (plural of genus). Dogs are in the species Canis lupus. That species contains both dogs and wolves. In the same genus is the coyote (Canis latrans), which is considered to be a distinct species from dogs and wolves (though Canis latrans and Canis lupus are so closely related that they can interbreed successfully). Apples are Malus domesticus. If you have ants in your house, it’s very likely the Argentine ant, Linepithema humile, an invasive species from South America.
Because the names in the Linnaean system have two parts, the system is called binomial nomenclature. You’ll also see these names referred to as binomials, as scientific names, or as Latin names.
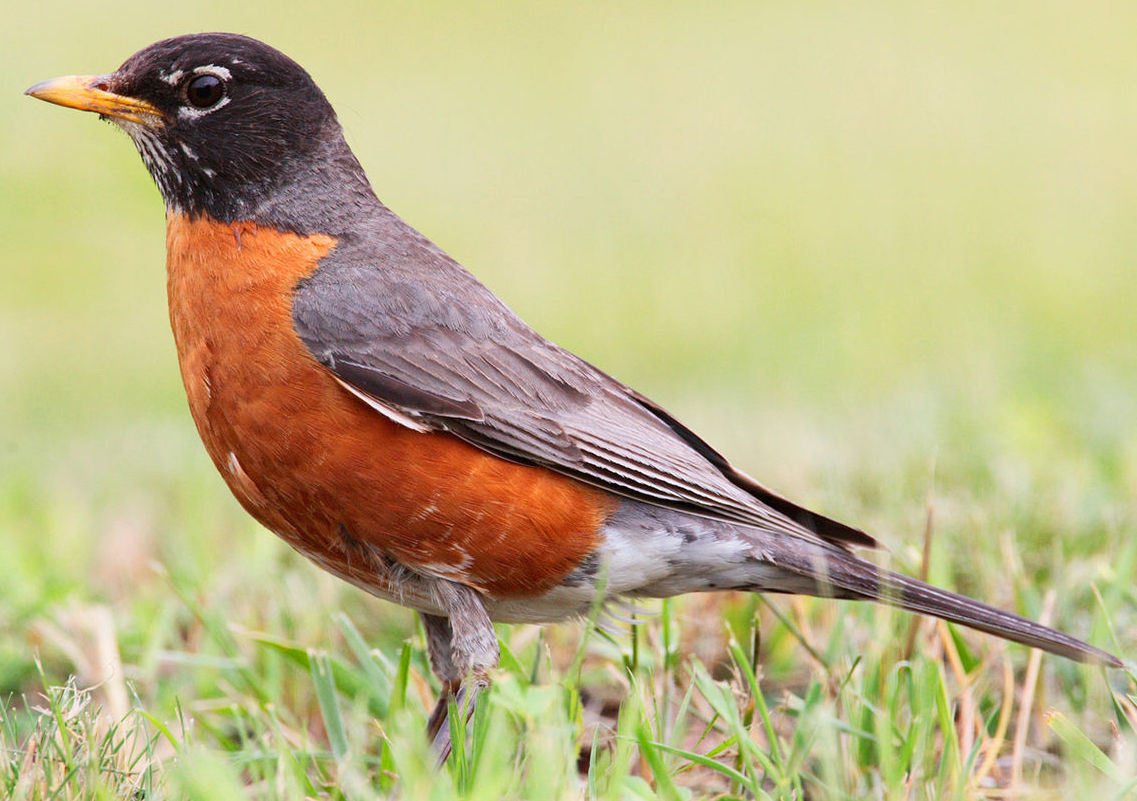
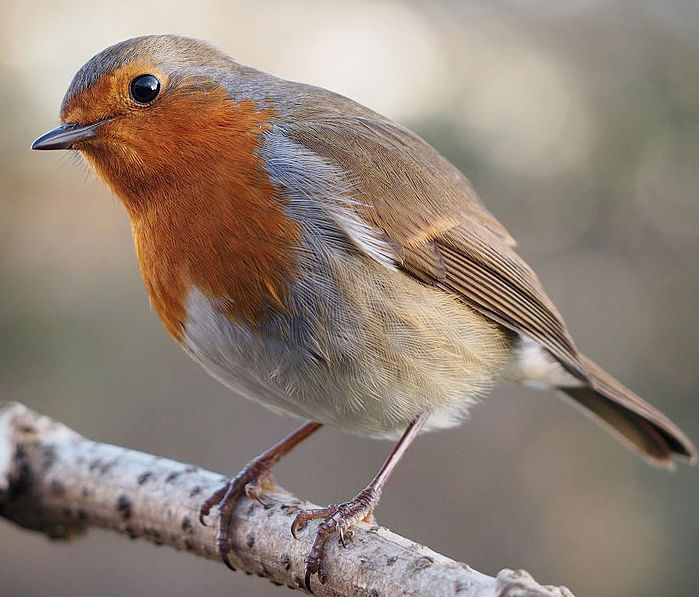
The Linnaean system avoids the confusion associated with the common names we have for species. For example, if you live in North America, the robin in front of your house or apartment is Turdus migratorius. But if you’re in Europe, what’s called a robin is Erithacus rubecula.
| Common name | Robin | Robin |
| Region | North America | Europe, North Africa |
| Scientific name | Turdus migratorius | Erithacus rubecula |
 |
 |
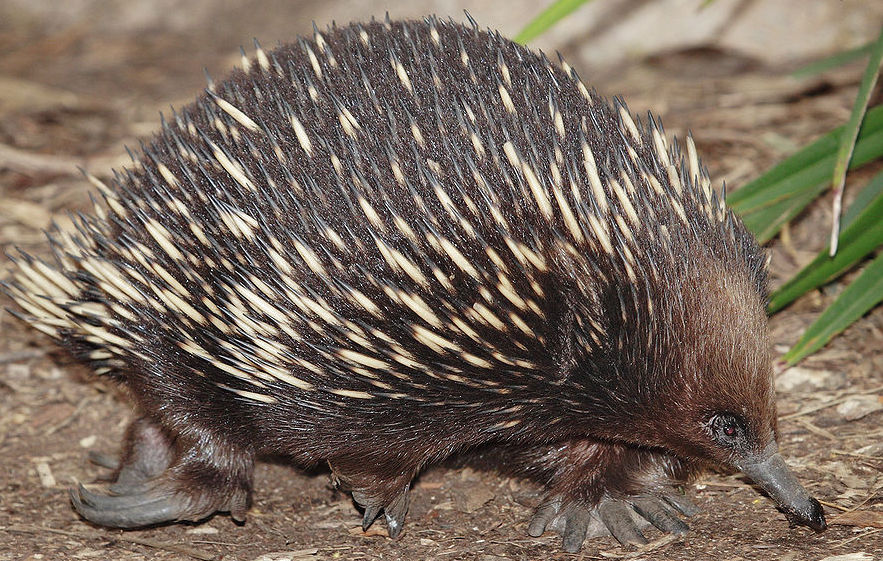
Similarly, what’s been called an anteater on 3 different continents is not the same species.
| Common name | Spiny Anteater | Cape Anteater | Giant Anteater |
| Region | Australia | Africa | South America |
| Scientific name | Tachyglossus aculeatus | Orycteropus afer | Myrmecophaga tridactyla |
 |
 |
 |
3b. Classification
No one knows how many species there are on our planet. In 2011, a joint study led by researchers at the University of Hawaii estimated that the number could be 8.7 million, with a margin of error of plus or minus 1.3 million. Over 1.25 million species have been formally named and described.
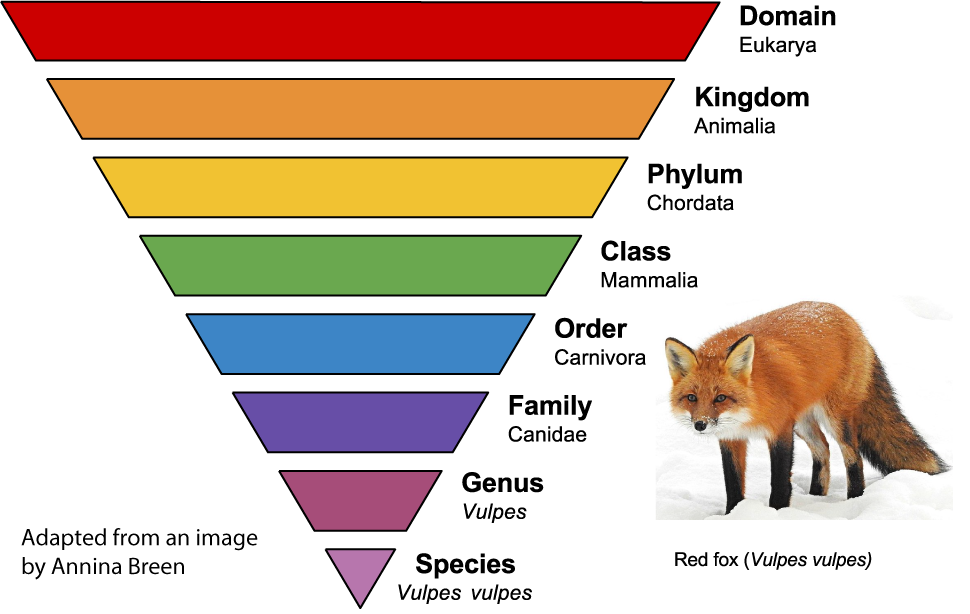
To organize all of these species, scientists classify them into increasingly general groups above the species level. Related species are grouped into a common genus. Related genera (plural of genus) are grouped into families. Related families are grouped into orders, which are grouped into classes, which are grouped into phyla, which are grouped into kingdoms, which are grouped into domains.
The image on the left shows the classification of the red fox, Vulpes vulpes. Each group is a taxon. Canidae is a taxon at the family level. In addition to foxes, it includes wolves and dogs. The taxon Carnivora is at the order level. In addition to dog-like mammals, carnivora includes bears, cats, weasels, raccoons, and walruses. As you move higher up, the taxa become more general and inclusive. As you move down, they become more specific and exclusive.
If you need to memorize the classification categories, you can use these mnemonics:
- Daring kings play chess on fine gray satin.
- Dear King Phillip came over for good soup.
4. Checking Understanding: Phylogenetic Trees, Binomial Nomenclature, and Classification
In addition to classification, this quiz reviews some of the material on phylogeny above,
[qwiz random = “true” qrecord_id=”sciencemusicvideosMeister1961-Phylogeny-2_classification and phylogenetic trees”]
[h] Introducing phylogenetic trees, binomial nomenclature, and classification
[i]Biohaiku
Homo sapiens
A noble binomial
Worth living up to
[q] A diagram like the one shown below is a [hangman] tree.
[c]IHBoeWxvZ2VuZXRpYw==[Qq]
[f]IEdyZWF0IQ==[Qq]
[q] A line of descent from an ancestor to its descendants (which would include “p” through “r” below”) is known as a [hangman].
[c]IGxpbmVhZ2U=[Qq]
[f]IEdyZWF0IQ==[Qq]
[q] In the diagram below, “A” is the [hangman] [hangman] of all of the other species in this phylogenetic tree.
[c]IGNvbW1vbg==[Qq]
[f]IEdyZWF0IQ==[Qq]
[c]IGFuY2VzdG9y[Qq]
[f]IEdyZWF0IQ==[Qq]
[q] A [hangman] is any named group of organisms. If it’s at the tip of the branch of a phylogenetic tree (like species 1 through 4 below), it’s called a [hangman] [hangman].
[c]IHRheG9u[Qq]
[f]IENvcnJlY3Qh[Qq]
[c]IHRlcm1pbmFs[Qq]
[f]IEV4Y2VsbGVudCE=[Qq]
[c]IHRheG9u[Qq]
[f]IEdyZWF0IQ==[Qq]
[q] A group that consists of a common ancestor and all of its descendants is known as a [hangman].
[c]Y2xhZGU=[Qq]
[q]Letters “A,” “B,” and “C” can also be thought of as [hangman] points. They’re also called [hangman]. These are points where [hangman] events occured.
[c]YnJhbmNo[Qq]
[c]bm9kZXM=[Qq]
[c]c3BlY2lhdGlvbg==[Qq]
[q] In the Linnaean system, a binomial like Turdus migratorius has two parts. Turdus is the [hangman], while migratorius designates the particular [hangman].
[c]IGdlbnVz[Qq]
[f]IENvcnJlY3Qh[Qq]
[c]IHNwZWNpZXM=[Qq]
[f]IEV4Y2VsbGVudCE=[Qq]
[q] In the Linnaean classification system, the domain is the most [hangman] and inclusive taxon, while the species is the most [hangman].
[c]IGdlbmVyYWw=[Qq]
[f]IEV4Y2VsbGVudCE=[Qq]
[c]IHNwZWNpZmlj[Qq]
[f]IEdvb2Qh[Qq]
[q multiple_choice=”true”] Of the taxa listed below, which would have the most species?
[c]IENob3 JkYXRh[Qq]
[f]IEV4Y2VsbGVudC4gQ2hvcmRhdGEgaXMgYSBwaHlsdW0sIGFuZCB0aGF0JiM4MjE3O3MgdGhlIG1vc3QgaW5jbHVzaXZlIHRheG9uIG9mIHRoZSB0aHJlZSBzaG93biBoZXJlLg==[Qq]
[c]IE1hbW1hbGlh[Qq]
[f]IE5vLiBNYW1tYWxpYSBpcyBhIHRheG9uIGF0IHRoZSBjbGFzcyBsZXZlbC4gVGhlcmUmIzgyMTc7cyBhIG1vcmUgaW5jbHVzaXZlIHRheG9uIHRoaXMgbGlzdC4=[Qq]
[c]IENhcm5pdm9yYQ==[Qq]
[f]IE5vLiBDYXJuaXZvcmEgaXMgYSB0YXhvbiBhdCB0aGUgbGV2ZWwgb2YgJiM4MjIwO29yZGVyLiYjODIyMTsgU2VlIGlmIHlvdSBjYW4gZmluZCBhIG1vcmUgaW5jbHVzaXZlIHRheG9uLg==[Qq]
[/qwiz]
5. Phylogenetic trees: A deeper look
5a. Ingroups, Outgroups, and Shared Derived Features
Let’s look at a phylogenetic tree that shows the phylogenetic relationships among seven different vertebrate taxa. Note that you can scroll the text below the phylogenetic tree below so that you can look at the tree and read the text.

Seven? But there are eight taxa listed on the diagrams. One of them, however, is not a vertebrate. Vertebrates are animals with a vertebral column .
Every one of the seven organisms from the salmon on down to the the gorilla is a member of the vertebrate clade, which we’ll call the ingroup. The ingroup is the subject of our analysis.
As a point of reference, we’ve included an animal that’s not a vertebrate. This animal is a hagfish.
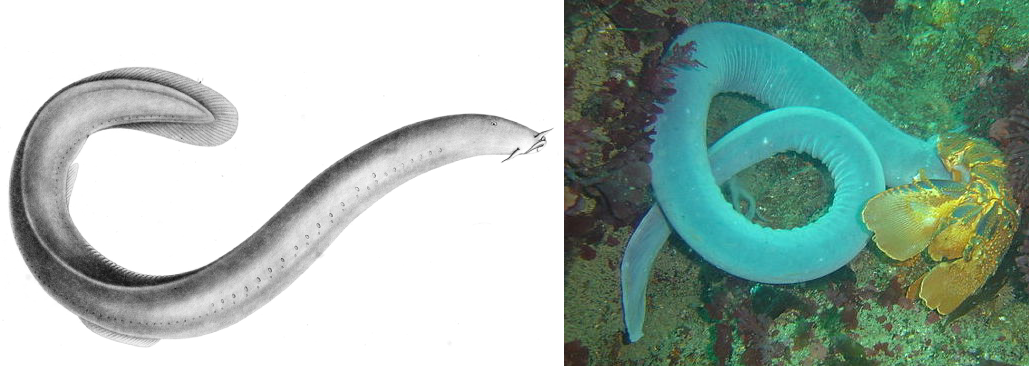
Hagfish are in the chordate phylum, but because they lack a vertebral column, they’re not vertebrates. That makes the hagfish an ideal outgroup: a taxon that allows us to identify the common ancestor of the ingroup. Because this phylogenetic tree has an identifiable common ancestor, the tree is rooted. The common ancestor of the ingroup (the vertebrates) would be at node B.
The ingroup is a clade. All of the species within this clade have a shared derived feature that unites them as members of a clade. For example, the clade that consists of all the descendants of “B” have jaws as their shared derived feature. Organisms outside this clade — such as the hagfish — lack this feature.
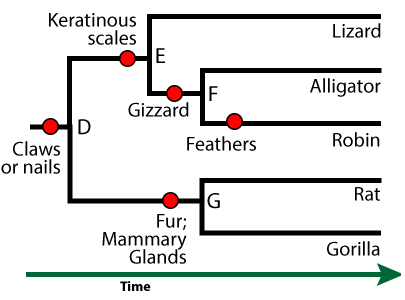
In this phylogenetic tree, the shared derived features are indicated by red circles. Here are some of the other shared, derived features that define some of the other clades in this tree.
- Lungs and four limbs unite the clade that includes frogs, lizards, alligators, robins, rats, and gorillas. Because these animals have four limbs, they’re known as tetrapods.
- Having a gizzard unites the robin and alligator within their clade.
- Fur and mammary glands unites the rat and gorilla within their clade (the mammals)
Features that the members of a clade share, but which are also shared by larger, more inclusive clades, are called ancestral features. For example, the clade that includes “G” and its descendants (rats and gorillas) is the mammal clade. An ancestral feature of the mammal clade would be “claws or nails.” Every mammal has this trait, but it’s not useful in defining the mammal clade, because it’s found in other organisms outside the clade (such as a birds and alligators).
Sister taxa are two descendants that split off from the same ancestor. In this phylogenetic tree, rats and gorillas are sister taxa. So are robins and alligators.
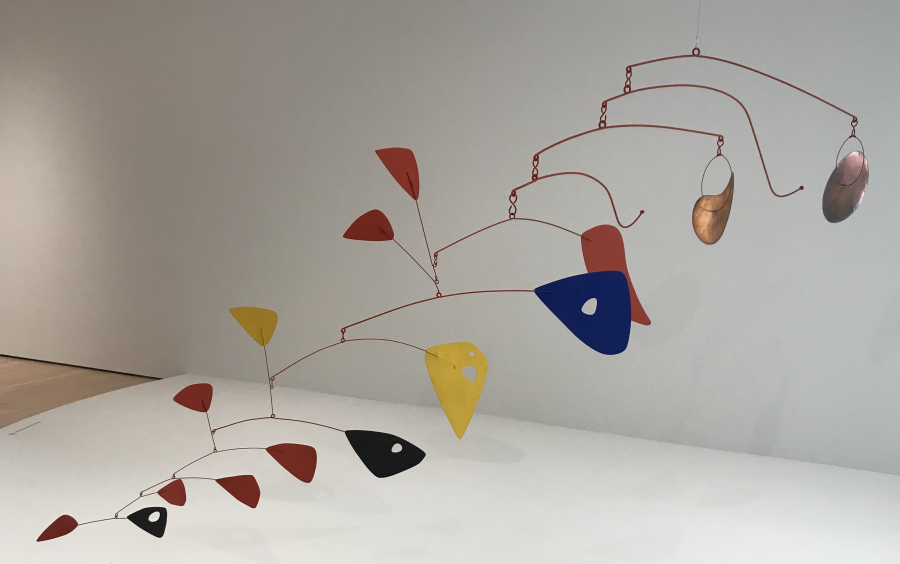
MISCONCEPTION ALERT: In a horizontally organized phylogenetic tree, like this one, the vertical arrangement of the terminal taxa says nothing about how closely related these taxa are. For example, a frog is no more closely related to a lizard than it is to a gorilla. That’s because the lineages in a phylogenetic tree can rotate around the nodes. A useful mental trick is to think of them as a mobile sculpture, with the root attached to the ceiling.
In other words, these two phylogenetic trees are equivalent.
But if you can’t identify the closest relationship by who’s next to whom, then how can you tell? You tell by moving back in time and finding the most recent common ancestor. Alligators and robins, for example, have a common ancestor at node “F.” Alligators and lizards have a common ancestor at “E.” Because the ancestor between robins and alligators is more recent than the common ancestor between alligators and lizards, you can conclude that alligators and robins are more closely related than alligators and lizards (something you might not have expected, because alligators and lizards are both classified as reptiles: more on this below).
5b. Connecting Phylogeny and Classification
Any clade (a group derived from a common ancestor) could be a taxon. For example, there’s a name for the clade shown below.
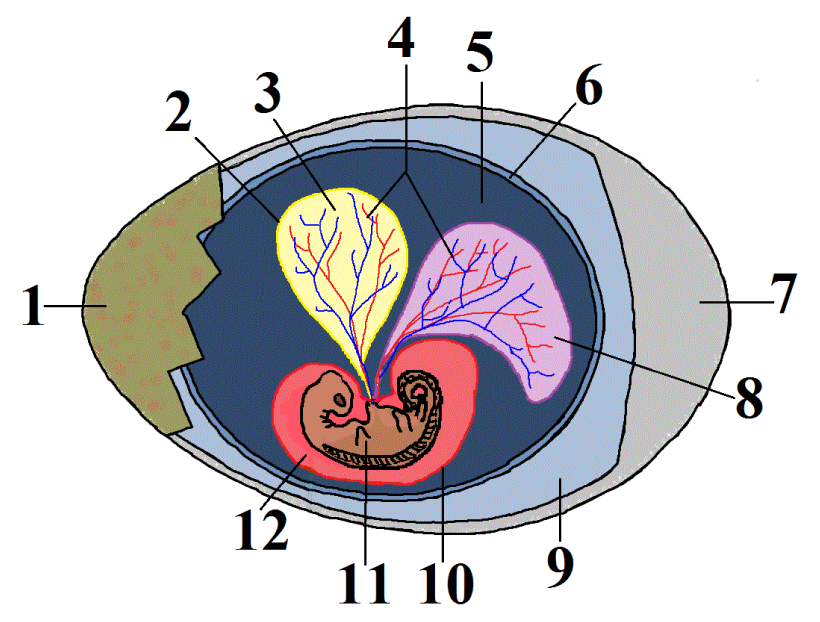
This group is called the amniotes. In addition to possessing the shared derived trait of claws or nails, these tetrapods (four limbed vertebrates) produce a complex egg with an internal, fluid-filled sac that surrounds and nourishes an embryo (shown at 11 at left). This watery internal environment is called an amnion (12). It’s surrounded by an amniotic sac (10) — the same sac that ruptures when a woman’s “water” breaks shortly before birth. The “water” is actually the amniotic fluid. The amniotic egg is what allowed reptiles, birds, and mammals to live a truly terrestrial life, as opposed to amphibians, whose simpler, fish-like eggs must be laid in water.
While all clades can be taxa, the reverse is not necessarily true. The group we call reptiles, for example, is not a clade.
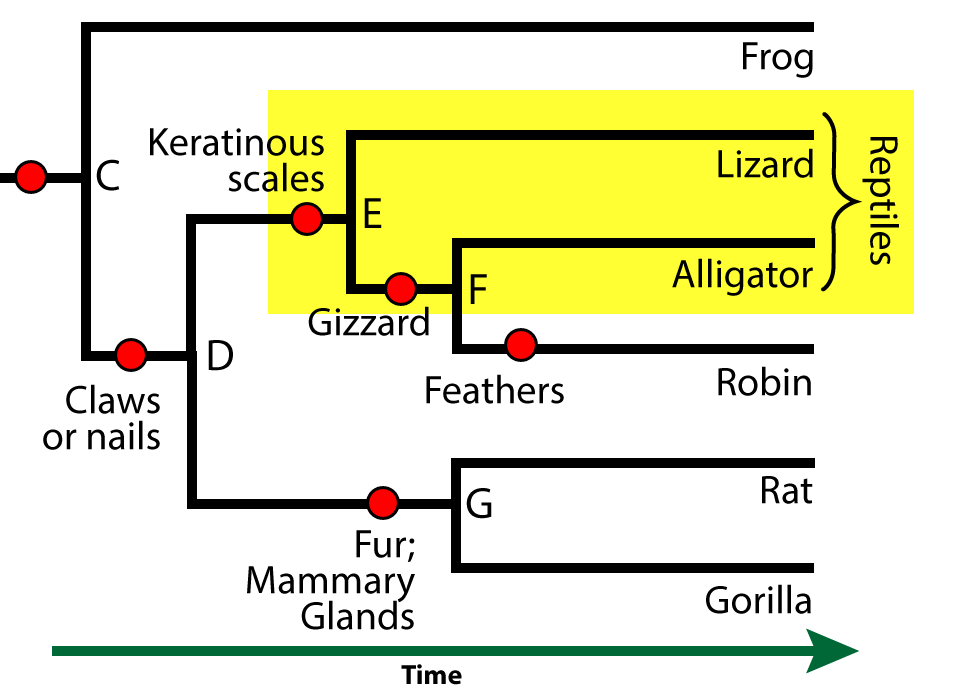
That’s because it consists of lizards and alligators (along with other reptiles that aren’t shown here, like snakes), but it excludes birds. Is there a taxon that includes all of these animals? Yes, but it’s not commonly known. It’s called sauropsida, and if you’re interested, you can read more about it at this article in Wikipedia.
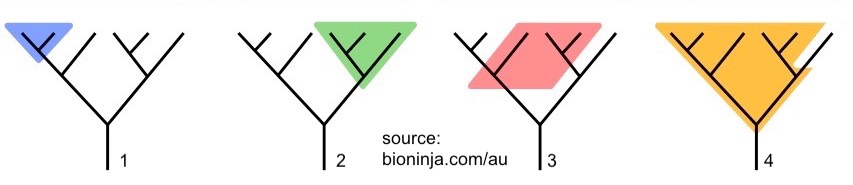
Take a look at the groups shown in the phylogenetic trees below. Note that all four trees have the same branching pattern. What’s different are the shaded branches, which indicate different taxa.
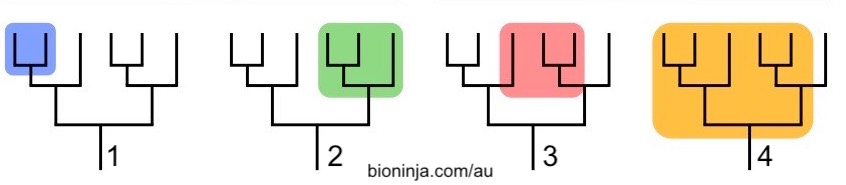
The shaded areas in trees 1 and 2 are both clades: they consist of the common ancestor of the clade, and all of its descendants. Such groups are said to be monophyletic.
The shaded group in tree 3 consists of lineages that derive from two separate ancestors. Such a group is said to be polyphyletic. The now-outmoded taxonomic group called protists (single celled eukaryotes) is a polyphyletic group. So are groups like “marine mammals,” or “trees.”
A paraphyletic group is descended from a common ancestor, but doesn’t include all of the descendants. Unless you consider chickens (and all other birds) to be dinosaurs, then the group we consider to be dinosaurs is a paraphyletic grouping (because it excludes the birds, which should be part of this group). Reptiles are another paraphyletic clade.
5c. Phylogenetic trees can be represented in a variety of ways
All of the phylogenetic trees shown in this tutorial so far have been drawn with lines going either horizontally or vertically. Another style of phylogenetic trees is drawn with diagonal lines.
The trees shown below and the taxa within them are exactly equivalent to the ones above. In the quiz that follows, and in textbooks, websites, etc, you’ll see both.
Finally, note that a distinction can be made between a cladogram and a phylogenetic tree.
 Strictly speaking, a cladogram shows the branching pattern of evolution only, with no reference to time. A phylogenetic tree, by contrast, is usually scaled, with branch lengths being proportional to the amount of time between the events indicated on the tree. Many sources, however, use the terms interchangeably.
5d. Phylogenetic Trees, Checking Understanding
[qwiz random = “true” qrecord_id=”sciencemusicvideosMeister1961-Phylogeny-3_Phyl Trees, Checking Understanding”]
[h] Phylogenetic Trees: Checking Understanding
[i]
[q] In a phylogenetic study, this taxon is
- not part of the ingroup
- close enough to the ingroup to allow for meaningful comparisons to the ingroup.
Such a group is known as the [hangman].
[c]IG91dGdyb3Vw[Qq]
[f]IEV4Y2VsbGVudCE=[Qq]
[q] If the shaded group at II below is the subject of a phylogenetic study, then group I is the [hangman].
[c]IG91dGdyb3Vw[Qq]
[f]IEV4Y2VsbGVudCE=[Qq]
[q] If X is the common ancestor of taxa J, K, L, M and N, then this tree can be described as being [hangman].
[c]IHJvb3RlZA==[Qq]
[f]IEdyZWF0IQ==[Qq]
[q multiple_choice=”true”] In the phylogenetic tree below, the shared derived trait of clade “F” is (a)
[c]IEtlcmF0aW5vdXMgc2NhbGVz[Qq]
[f]IE5vLiBGb3IgY2xhZGUgJiM4MjIwO0YsJiM4MjIxOyBrZXJhdGlub3VzIHNjYWxlcyB3b3VsZCBiZSBhbiBhbmNlc3RyYWwgZmVhdHVyZS4gQSBzaGFyZWQgZGVyaXZlZCBmZWF0dXJlIGlzIG9uZSB0aGF0IHNldHMgdGhlIG1lbWJlcnMgb2YgYSBjbGFkZSBhcGFydCBmcm9tIG90aGVyIGNsYWRlcy4=[Qq]
[c]IEdpen phcmQ=[Qq]
[f]IEV4Y2VsbGVudC4gQSBnaXp6YXJkIHNldHMgdGhlIG1lbWJlcnMgb2YgYSBjbGFkZSAmIzgyMjA7RiYjODIyMTsgYXBhcnQgZnJvbSBvdGhlciBjbGFkZXMsIG1ha2luZyBpdCB0aGVpciBzaGFyZWQgZGVyaXZlZCBmZWF0dXJlLg==[Qq]
[c]IEZlYXRoZXJz[Qq]
[f]IE5vLsKgT25seSBzb21lIG1lbWJlcnMgb2YgY2xhZGUgJiM4MjIwO2YmIzgyMjE7IGhhdmUgZmVhdGhlcnMuIEEgc2hhcmVkIGRlcml2ZWQgZmVhdHVyZSBpcyBvbmUgdGhhdCBzaGFyZWQgYnkgYWxsIG1lbWJlcnMgb2YgYSBjbGFkZSwgYW5kIHdoaWNoIHNldHMgdGhlIG1lbWJlcnMgb2YgYSBjbGFkZSBhcGFydCBmcm9tIG90aGVyIGNsYWRlcy4gRmluZCBhIGZlYXR1cmUgdGhhdCBmaXRzIHRob3NlIHJlcXVpcmVtZW50cy4=
Cg==[Qq]
[q] Based on the phylogenetic tree below, the alligator and robin could be described as [hangman] taxa.
[c]IHNpc3Rlcg==[Qq]
[f]IEV4Y2VsbGVudCE=[Qq]
[q multiple_choice=”true”] In the phylogenetic tree below, an ancestral trait for clade “F” would be
[c]IEtlcmF0aW5v dXMgc2NhbGVz[Qq]
[f]IEV4Y2VsbGVudC4gRm9yIGNsYWRlICYjODIyMDtGLCYjODIyMTsga2VyYXRpbm91cyBzY2FsZXMgaXMgYW4gYW5jZXN0cmFsIGZlYXR1cmUuIEl0IHdhcyBpbmhlcml0ZWQgZnJvbSBhIGNvbW1vbiBhbmNlc3RvciwgYnV0IG5vdCBmcm9tIGEgY2xvc2UgZW5vdWdoIGFuY2VzdG9yIHRvIGRpc3Rpbmd1aXNoIHRoaXMgY2xhZGUgZnJvbSBvdGhlciBjbGFkZXMu[Qq]
[c]IEdpenphcmQ=[Qq]
[f]IE5vLiBBIGdpenphcmQ=IHNldHMgdGhlIG1lbWJlcnMgb2YgYSBjbGFkZSAmIzgyMjA7RiYjODIyMTsgYXBhcnQgZnJvbSBvdGhlciBjbGFkZXMsIG1ha2luZyBpdCBhIHNoYXJlZCBkZXJpdmVkIGZlYXR1cmUuIEFuIGFuY2VzdHJhbCB0cmFpdCBpcyBhbHNvIGluaGVyaXRlZCBmcm9tIGEgY29tbW9uIGFuY2VzdG9yLCBidXQgaXRzIG5vdCBhIHRyYWl0IHRoYXQgZGlzdGluZ3Vpc2hlcyB0aGlzIGNsYWRlIGZyb20gb3RoZXIgY2xhZGVzLsKg[Qq]
[c]IEZlYXRoZXJz[Qq]
[f]IE5vLsKgT25seSBzb21lIG1lbWJlcnMgb2YgY2xhZGUgJiM4MjIwO2YmIzgyMjE7IGhhdmUgZmVhdGhlcnMsIG1ha2luZyB0aGF0IGZlYXR1cmUgbmVpdGhlciBhIHNoYXJlZCBkZXJpdmVkIHRyYWl0IG9yIGFuIGFuY2VzdHJhbCB0cmFpdC4=
Cg==[Qq]
[q] Which of the trees below depicts a taxon that is polyphyletic?
[textentry single_char=”true”]
[c]ID M=[Qq]
[f]IE5pY2Ugam9iISAmIzgyMjA7MyYjODIyMTsgaXMgYSBwb2x5cGh5bGV0aWMgdGF4b24u[Qq]
[c]IEVudGVyIHdvcmQ=[Qq]
[f]IE5vLCB0aGF0JiM4MjE3O3Mgbm90IGNvcnJlY3Qu[Qq]
[c]ICo=[Qq]
[f]IE5vLiBIZXJlJiM4MjE3O3MgYSBoaW50OiBBIHBvbHlwaHlsZXRpYyB0YXhvbiBpcyBvbmUgaW4gd2hpY2ggdGhlIG1lbWJlcnMgaGF2ZSBkaWZmZXJlbnQgY29tbW9uIGFuY2VzdG9ycy4gV2hpY2ggdGF4b24gY291bGQgZml0IHRoYXQgZGVzY3JpcHRpb24/[Qq]
[q] Which of the trees below depicts a taxon that is paraphyletic?
[textentry single_char=”true”]
[c]ID Q=[Qq]
[f]IEdvb2Qgam9iISAmIzgyMjA7NCYjODIyMTsgaXMgYSBwYXJhcGh5bGV0aWMgdGF4b24u[Qq]
[c]IEVudGVyIHdvcmQ=[Qq]
[f]IE5vLCB0aGF0JiM4MjE3O3Mgbm90IGNvcnJlY3Qu[Qq]
[c]ICo=[Qq]
[f]IE5vLiBIZXJlJiM4MjE3O3MgYSBoaW50OiBBIHBhcmFwaHlsZXRpYyB0YXhvbiBpcyBvbmUgaW4gd2hpY2ggdGhlIG1lbWJlcnMgdGhlIHNhbWUgY29tbW9uIGFuY2VzdG9yLCBidXQgbm90IGFsbCBvZiB0aGUgZGVzY2VuZGFudHMgYXJlIHBhcnQgb2YgdGhlIGNsYWRlLsKg[Qq]
[q] In a monophyletic taxon, the taxon can be described in one word: a [hangman].
[c]IGNsYWRl[Qq]
[f]IENvcnJlY3Qh[Qq]
[q] The problem with a taxon that included only alligators and lizards is that this taxon would not be a [hangman]. That’s because its common ancestor at letter E was also the ancestor of birds, making this taxon [hangman].
[c]IGNsYWRl[Qq]
[f]IENvcnJlY3Qh[Qq]
[c]IHBhcmFwaHlsZXRpYw==[Qq]
[f]IEdvb2Qh[Qq]
[q] Clade 2 below could be described as [hangman]
[c]IG1vbm9waHlsZXRpYw==[Qq]
[/qwiz]
6. Using Character Tables to Create Phylogenetic Trees
To create a phylogenetic tree, biologists start from character tables. A character is any quantifiable, heritable trait. Here are some examples of characters:
- The presence or absence of any inherited trait: wings, legs, eyes, etc.
- A nucleotide sequence for a gene that’s shared among several species
- An amino acid sequence for a shared protein, such as cytochrome c or hemoglobin
- The number of segments in an animal’s backbone.
6a. Inferring a phylogeny based on morphology
The best way to understand how phylogenetic trees are built is to build one!
[qwiz style=”width: 600px !important;” qrecord_id=”sciencemusicvideosMeister1961-Phylogeny 4_vertebrate character table”]
[h] Character tables and phylogenetic trees
[i]
[q labels = “top”]Here’s a character table for seven vertebrates. A “1” means that the trait it present. “0” means that it’s absent. Based on the table, organize these animal into a phylogenetic tree. Place shared derived traits near the red rectangles. Place the animals on the top.
[l]alligator
[fx] No. Please try again.
[f*] Correct!
[l]amniotic egg
[fx] No, that’s not correct. Please try again.
[f*] Good!
[l]bony skeleton
[fx] No. Please try again.
[f*] Excellent!
[l]four limbs
[fx] No. Please try again.
[f*] Correct!
[l]egg w/ shell
[fx] No, that’s not correct. Please try again.
[f*] Good!
[l]hair
[fx] No. Please try again.
[f*] Correct!
[l]newt
[fx] No. Please try again.
[f*] Excellent!
[l]rabbit
[fx] No. Please try again.
[f*] Correct!
[l]shark
[fx] No. Please try again.
[f*] Good!
[l]trout
[fx] No. Please try again.
[f*] Correct!
[l]vertebral column
[fx] No. Please try again.
[f*] Correct!
[q multiple_choice=”true”]Based on the phylogeny below, which of the following statements is true?
[c]VGhlIG5ld3QmIzgyMTc7cyBjbG9zZXN0IHJlbGF0aXZlIGlzIHRoZSByYWJiaXQu[Qq]
[f]Tm8uIFJlbWVtYmVyIHRoYXQgaW4gYSBwaHlsb2dlbmV0aWMgdHJlZSwgdGhlIGJyYW5jaGVzIGNhbiByb3RhdGUgYXJvdW5kIGFueSBub2RlLiBJZiB5b3Ugcm90YXRlZCB0aGUgYW1uaW90ZXMsIHRoZW4gdGhlIGNoaWNrZW4gd291bGQgc2hvdyB1cHMgbmV4dCB0byB0aGUgbmV3dC4=[Qq]
[c]VGhlIG5ld3QgaXMgY2xvc2VyIHRvIHRoZS BhbGxpZ2F0b3IgdGhhbiB0aGUgdHJvdXQu[Qq]
[f]RXhjZWxsZW50LiBUaGUgbmV3dCBoYXMgYSBtb3JlIHJlY2VudCBjb21tb24gYW5jZXN0b3Igd2l0aCB0aGUgYWxsaWdhdG9yIHRoYW4gd2l0aCB0aGUgdHJvdXQu[Qq]
[c]VGhlIG5ld3QgYW5kIHRoZSByYWJiaXQgYXJlIHNpc3RlciBzcGVjaWVzLg==[Qq]
[f]Tm8uIFNpc3RlciBzcGVjaWVzIG9yaWdpbmF0ZSBmcm9tIHRoZSBzYW1lIG5vZGUu[Qq]
[q]This question is based on the phylogeny below. If you were studying the tetrapods (four limbed vertebrates), the most suitable outgroup would be the [hangman]
[c]dHJvdXQ=[Qq]
[/qwiz]
6b. Watch out for confusion related to convergent features
In terms of interpreting and creating phylogenies, not all inherited characters are of equal value. Characters are only useful if they’re homologous (derived from a common ancestor). They’re even more useful if they’re highly conserved. But if they’re analogous traits — ones that come about from convergent evolution — they can put you off track in determining phylogeny. This is shown in the following example.
Let’s say that you were assigned the task of figuring out a phylogenetic tree for the following four organisms: a rat, a bat, a bird, a frog, and a fish.
[qwiz qrecord_id=”sciencemusicvideosMeister1961-Phylogeny-5_convergence”]
[h]Watch out for convergence!
[i]
[q labels = “top”]In the following character table, use “X” to indicate a trait’s presence, and a “0” to indicate its absence.
| Shared Characters | Rat | Bat | Bird | Frog | Fish |
| Vertebral column | ___ | ___ | ___ | ___ | ___ |
| Four limbs | ___ | ___ | ___ | ___ | ___ |
| Wings | ___ | ___ | ___ | ___ | ___ |
| Amniotic egg | ___ | ___ | ___ | ___ | ___ |
[l]X
[fx] No, that’s not correct. Please try again.
[f*] Correct!
[l]0
[fx] No, that’s not correct. Please try again.
[f*] Great!
[q labels = “top”]Now, use the character table you just created to complete the phylogenetic tree below. Note: this phylogeny is wrong: we’re making it to prove a point.
[l]Amniotic sac
[fx] No, that’s not correct. Please try again.
[f*] Excellent!
[l]Bird
[fx] No, that’s not correct. Please try again.
[f*] Great!
[l]Fish
[fx] No, that’s not correct. Please try again.
[f*] Excellent!
[l]Four limbs
[fx] No, that’s not correct. Please try again.
[f*] Good!
[l]Frog
[fx] No, that’s not correct. Please try again.
[f*] Great!
[l]Rat
[fx] No. Please try again.
[f*] Correct!
[l]Wings
[fx] No. Please try again.
[f*] Excellent!
[q]The problem with the phylogenetic tree below is that one of the characters, [hangman], is NOT a [hangman] [hangman] feature. Rather, it’s an [hangman] trait that resulted from convergent evolution (adaptation to a flying niche).
[c]d2luZ3M=[Qq]
[c]c2hhcmVk[Qq]
[c]ZGVyaXZlZA==[Qq]
[c]YW5hbG9nb3Vz[Qq]
[q]Let’s try to analyze these organisms using improved characters. As opposed to wings (an analogous trait) in birds and bats, let’s use hair and feathers instead.
| Shared Characters | Rat | Bat | Bird | Frog | Fish |
| Vertebral column | ___ | ___ | ___ | ___ | ___ |
| Four limbs | ___ | ___ | ___ | ___ | ___ |
| Hair | ___ | ___ | ___ | ___ | ___ |
| Amniotic egg | ___ | ___ | ___ | ___ | ___ |
| Feathers | ___ | ___ | ___ | ___ | ___ |
[l]X
[fx] No, that’s not correct. Please try again.
[f*] Good!
[l]0
[fx] No. Please try again.
[f*] Excellent!
[q labels = “top”]Based on the character table below, draw a new phylogenetic tree.
[l]Amniotic sac
[fx] No. Please try again.
[f*] Great!
[l]Bat
[fx] No, that’s not correct. Please try again.
[f*] Excellent!
[l]Bird
[fx] No, that’s not correct. Please try again.
[f*] Good!
[l]Feathers
[fx] No. Please try again.
[f*] Correct!
[l]Fish
[fx] No. Please try again.
[f*] Excellent!
[l]Four limbs
[fx] No, that’s not correct. Please try again.
[f*] Great!
[l]Frog
[fx] No. Please try again.
[f*] Excellent!
[l]Hair
[fx] No, that’s not correct. Please try again.
[f*] Excellent!
[q]The advantage of tree 1 below is that it only uses traits that are shared [hangman] characters. The takeaway: when constructing phylogenetic trees, make sure you use traits that are [hangman] (from common ancestry), as opposed to [hangman] (from convergent evolution).
[c]ZGVyaXZlZA==[Qq]
[c]aG9tb2xvZ291cw==[Qq]
[c]YW5hbG9nb3Vz[Qq]
[q]The phylogenetic tree below shows a variety of mammals, along with their ability to synthesize vitamin C. Lineages shown in black can synthesize vitamin C. Those in gray can’t, and must obtain vitamin C from their environment. Based on the pattern in the diagram, the inability of primates (owl marmosets to humans) is a [hangman] [hangman] feature. But, the fact that guinea pigs can’t synthesize vitamin C is the result of [hangman] evolution. It’s an [hangman] trait.
[c]c2hhcmVk[Qq]
[c]ZGVyaXZlZA==[Qq]
[c]Y29udmVyZ2VudA==[Qq]
[c]YW5hbG9nb3Vz[Qq]
[/qwiz]
6c. Molecular data can also be used to infer phylogenetic relationships
In the examples below, we’ll see how similarities and differences in amino acid and nucleotide sequences can be used to determine phylogenetic relationships.
[qwiz qrecord_id=”sciencemusicvideosMeister1961-Phylogeny-6_molecular data”]
[h]Phylogeny based on molecular homologies
[i]Cytochrome c is a highly conserved protein
[q]Cytochrome c is a protein that’s a part of the mitochondrial electron transport chain. In multicellular eukaryotes, in addition to its role in chemiosmotic production of ATP, it also plays a role in initiating apoptosis (programmed cell death)
The structure of cytochrome c is highly conserved, and differences in its primary structure can be used to determine evolutionary relationships.
[q]Study the table below. It shows the number of amino acid differences in the cytochrome c in 5 different species. Just a quick glance tells you that the chicken’s cytochrome c is most similar to that of the [hangman], and most different from that of [hangman].
[c]cGVuZ3Vpbg==[Qq]
[c]eWVhc3Q=[Qq]
[q labels = “top”]Based on the cytochrome c differences in the table below, drag the organisms below into the correct position. Note the position of the chicken
[l]moth
[fx] No, that’s not correct. Please try again.
[f*] Good!
[l]penguin
[fx] No. Please try again.
[f*] Good!
[l]snake
[fx] No, that’s not correct. Please try again.
[f*] Good!
[l]yeast
[fx] No, that’s not correct. Please try again.
[f*] Good!
[q labels = “top”]In this case, the data from amino acids confirms what we’d expect from classification based on more traditional morphological traits. It makes sense that penguins and chickens would share the closest amino acid ____________. That’s because they’re both __________. Within a close margin of error, both of these animals are equally closely related to the ___________. This also makes sense, because all three of these animals are in the ____________ clade.
[l]vertebrate
[fx] No. Please try again.
[f*] Good!
[l]birds
[fx] No, that’s not correct. Please try again.
[f*] Excellent!
[l]sequence
[fx] No, that’s not correct. Please try again.
[f*] Great!
[l]snake
[fx] No, that’s not correct. Please try again.
[f*] Excellent!
[q]DNA sequences are also used to infer phylogenetic relationships. Because of the amount of data involved, DNA data is usually analyzed by computers that use algorithms to determine the most likely relationships. But by looking at just a few homologous nucleotide sequences, you can get a sense of how this type of analysis works.
The table below shows a stretch of 16 homologous nucleotides within the DNA of Hawaiian honeycreepers. These birds, along with the Galapagos Finches, are a widely studied example of adaptive radiation. A “-” indicates that the nucleotide is identical. Based on the sequence, see what you can figure out about honeycreeper evolution.
Here’s a hint to help you get started. Find the nucleotide position that’s has an identical nucleotide in all the the five birds shown. That’s a trait that’s shared by all of the birds, and it’ll go at the root of the tree you’ll build in the next card. The answer is a number.
[textentry single_char=”true”]
[c]Mg ==[Qq]
[f]WWVzLiBUaGUgbnVjbGVvdGlkZSAmIzgyMjA7VCYjODIyMTsgaXMgaW4gcG9zaXRpb24gMiBpbiBhbGwgZml2ZSBzcGVjaWVzLg==[Qq]
[c]Kg==[Qq]
[f]Tm8uIEhlcmUmIzgyMTc7cyBhIGhpbnQuIEl0IGludm9sdmVzIHRoZSBudWNsZW90aWRlICYjODIyMDt0aHltaW5lLiYjODIyMTs=[Qq]
[q labels = “top”]
[l]Common Rosefinch
[fx] No, that’s not correct. Please try again.
[f*] Great!
[l]Kaua’i ‘amakihi
[fx] No. Please try again.
[f*] Correct!
[l] ‘L’iwi
[fx] No, that’s not correct. Please try again.
[f*] Excellent!
[l]Po’ouli
[fx] No, that’s not correct. Please try again.
[f*] Good!
[l]A, position 1
[fx] No, that’s not correct. Please try again.
[f*] Good!
[l]A, position 16
[fx] No. Please try again.
[f*] Correct!
[l]C, position 4
[fx] No, that’s not correct. Please try again.
[f*] Great!
[l]T, position 2
[fx] No, that’s not correct. Please try again.
[f*] Correct!
[q]A similar type of analysis can be used to determine the source of HIV, the virus that causes AIDS. At some point during the 20th century, the virus jumped from animal populations to human populations. This viral crossover came about from blood-blood contact as humans butchered animals such as chimps and gorillas. Study the table below. It compares 3 strains of HIV to four strains of SIV (simian immunodeficiency virus). This virus infects chimps and gorillas. In these animals, SIV can cause symptoms similar to AIDS in humans. The source of the data is PBS’s NOVA Evolution Lab. The RNA shown is a stretch from a 645 base nucleotide sequence.
[q]Use the RNA nucleotide sequence data below to determine the evolutionary history of various strains of HIV. Note that on one of the branches, you’ll be able to reduce the possibilities to 50/50, and then you’ll have to guess. Good luck!
[l] SIV-TAN1
[fx] No. Please try again.
[f*] Good!
[l] SIV-MB897
[fx] No. Please try again.
[f*] Great!
[l] SIV-EK505
[fx] No. Please try again.
[f*] Correct!
[l] Gorilla SIV
[fx] No, that’s not correct. Please try again.
[f*] Correct!
[l] HIV-1 P
[fx] No. Please try again.
[f*] Correct!
[l] A position 1
[fx] No, that’s not correct. Please try again.
[f*] Excellent!
[l] A position 11
[fx] No, that’s not correct. Please try again.
[f*] Great!
[l] C position 1
[fx] No. Please try again.
[f*] Correct!
[l] G position 14
[fx] No. Please try again.
[f*] Great!
[l] U position 7
[fx] No, that’s not correct. Please try again.
[f*] Correct!
[q]Based on the phylogeny below, you can conclude that a group that consisted of the three strains shown below would not be a [hangman] grouping. Rather, each strain emerged [hangman] from strains of HIV in different groups of apes.
[c]bW9ub3BoeWxldGlj[Qq]
[c]aW5kZXBlbmRlbnRseQ==[Qq]
[/qwiz]
7. Molecular Clocks
In all phylogenetic trees, there’s an underlying assumption of the passage of time.
For example, in the phylogenetic tree above, you can assume that clade E emerged more recently than clade C, which emerged more recently than clade B. But there’s no explicit scale.
In other phylogenetic trees, the branch lengths are proportional to the passage of time.
These branch points can be dated from fossil evidence. But increasingly they’re dated based on what are called molecular clocks.
The basic idea behind molecular clocks is that for any specific protein or nucleic acid, the rate of change caused by accumulated mutations is constant over time. If you can calibrate the amount of change in a gene or protein to when two species split apart (a node in the tree), then you can
- Determine a rate of change in that gene or protein,
- Use that rate to determine when other species split in the tree split apart.
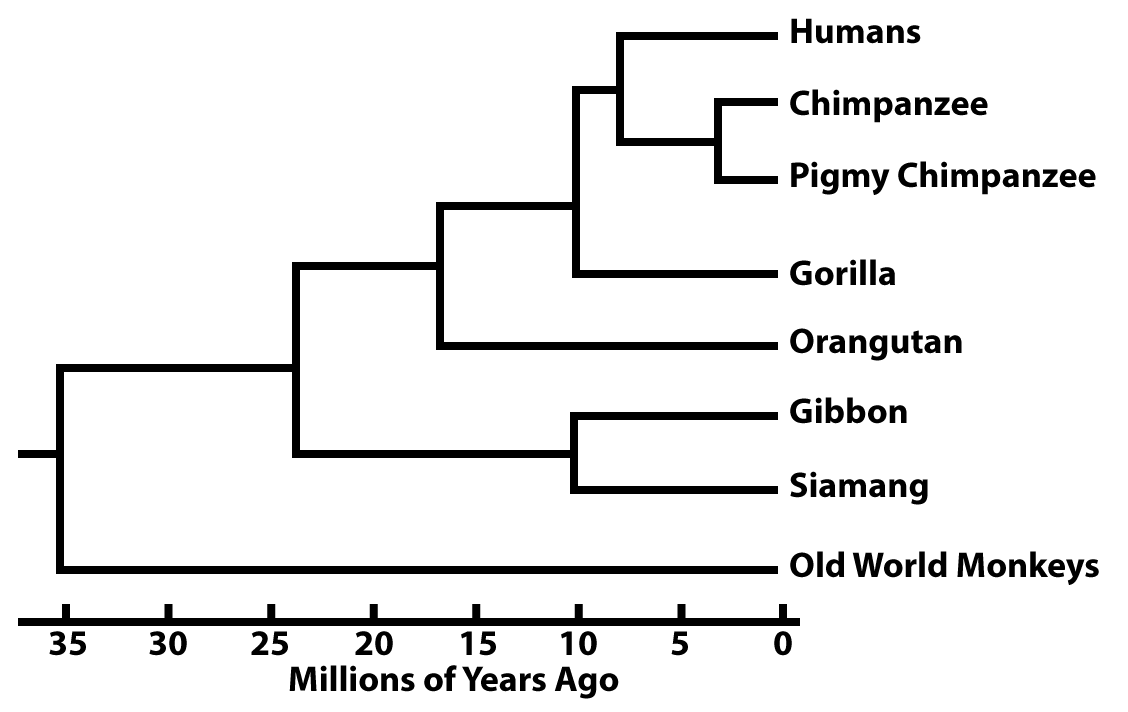
Here’s an imaginary example. Imagine a specific sequence of DNA that’s 100 nucleotides long, and it’s shared by all of the primates shown above. In Gibbons and Siamangs, that stretch of DNA is identical except for 10 substitutions. Based on fossil evidence, we learn that the split between Gibbons and Siamangs occured 10 million years ago.
That means that the rate of change in that nucleotide sequence is
- 10 mutations/10 million years, or
- one mutation/million years.
If we find that there are six nucleotide differences between in the same stretch of DNA that’s shared by humans and chimps, then a little algebra tells us that humans and chimps would have had a common ancestor about 6 million years ago.
[qwiz qrecord_id=”sciencemusicvideosMeister1961-Phylogeny-7_molecular clocks”]
[h] Molecular Clock Examples
[i]A widely used and highly conserved protein that’s used to determine divergence dates is hemoglobin, the oxygen carrying protein found in the red blood cells of almost all vertebrates. Hemoglobin is a quaternary protein, consisting of four protein chains. Two are alpha chains, and consist of 141 amino acids, and two are beta chains, with 146 amino acids.
The rate of mutation in hemoglobin has been calibrated with changes in the fossil record, allowing scientists to produce the graph below.
[q multiple_choice=”true”] There are 62 amino acid differences between human and frog hemoglobin. Use the graph below to determine when humans and frogs most recently shared a common ancestor.
[c]IDEwMCBtaWxsaW9uIHllYXJz[Qq]
[f]IE5vLiBIZXJlJiM4MjE3O3MgaG93IHRvIHByb2NlZWQuIElkZW50aWZ5IDYyIG9uIHRoZSBZIGF4aXMuIE5vdyBmaW5kIHdoZXJlIDYyIGludGVyY2VwdHMgdGhlIG1vbGVjdWxhciBjbG9jayBsaW5lLCBhbmQgdGhlbiBmaW5kIHRoZSBjb3JyZXNwb25kaW5nIHRpbWUgb24gdGhlIFggYXhpcy4=[Qq]
[c]IDI1MCBtaWxsaW9uIHllYXJz[Qq]
[f]IE5vLiBIZXJlJiM4MjE3O3MgaG93IHRvIHByb2NlZWQuIElkZW50aWZ5IDYyIG9uIHRoZSBZIGF4aXMuIE5vdyBmaW5kIHdoZXJlIDYyIGludGVyY2VwdHMgdGhlIG1vbGVjdWxhciBjbG9jayBsaW5lLCBhbmQgdGhlbiBmaW5kIHRoZSBjb3JyZXNwb25kaW5nIHRpbWUgb24gdGhlIFggYXhpcy4=[Qq]
[c]IDM1MCBtaWxs aW9uIHllYXJz[Qq]
[f]RXhjZWxsZW50LiBVc2luZyB0aGUgaGVtb2dsb2JpbiBtb2xlY3VsYXIgY2xvY2ssIHlvdSBjYW4gZXN0aW1hdGUgdGhlIGxhc3QgY29tbW9uIGFuY2VzdG9yIG9mIGh1bWFucyBhbmQgZnJvZ3MgYXMgaGF2aW5nIGV4aXN0ZWQgYWJvdXQgMzUwIG1pbGxpb24geWVhcnMgYWdvLsKg[Qq]
[c]IDUwMCBtaWxsaW9uIHllYXJz[Qq]
[f]IE5vLiBIZXJlJiM4MjE3O3MgaG93IHRvIHByb2NlZWQuIElkZW50aWZ5IDYyIG9uIHRoZSBZIGF4aXMuIE5vdyBmaW5kIHdoZXJlIDYyIGludGVyY2VwdHMgdGhlIG1vbGVjdWxhciBjbG9jayBsaW5lLCBhbmQgdGhlbiBmaW5kIHRoZSBjb3JyZXNwb25kaW5nIHRpbWUgb24gdGhlIFggYXhpcy4=[Qq]
[q multiple_choice=”true”] Cytochrome c is also used a molecular clock.
Humans and fruit flies have 29 differences in the amino acids making up their cytochrome c. Based on the graph below, which of the following is closest to the time when humans and fruit flies last shared a common ancestor?
[c]IDEwMCBtaWxsaW9uIHllYXJz[Qq]
[f]IE5vLiBIZXJlJiM4MjE3O3MgaG93IHRvIHByb2NlZWQuIElkZW50aWZ5IDI5IG9uIHRoZSBZIGF4aXMuIE5vdyBmaW5kIHdoZXJlIDI5IGludGVyY2VwdHMgdGhlIG1vbGVjdWxhciBjbG9jayBsaW5lLCBhbmQgdGhlbiBmaW5kIHRoZSBjb3JyZXNwb25kaW5nIHRpbWUgb24gdGhlIFggYXhpcy4=[Qq]
[c]IDI1MCBtaWxsaW9uIHllYXJz[Qq]
[f]IE5vLiBIZXJlJiM4MjE3O3MgaG93IHRvIHByb2NlZWQuIElkZW50aWZ5IDI5IG9uIHRoZSBZIGF4aXMuIE5vdyBmaW5kIHdoZXJlIDI5IGludGVyY2VwdHMgdGhlIG1vbGVjdWxhciBjbG9jayBsaW5lLCBhbmQgdGhlbiBmaW5kIHRoZSBjb3JyZXNwb25kaW5nIHRpbWUgb24gdGhlIFggYXhpcy4=[Qq]
[c]IDQwMCBtaWxsaW9uIHllYXJz[Qq]
[f]IE5vLiBIZXJlJiM4MjE3O3MgaG93IHRvIHByb2NlZWQuIElkZW50aWZ5IDI5IG9uIHRoZSBZIGF4aXMuIE5vdyBmaW5kIHdoZXJlIDI5IGludGVyY2VwdHMgdGhlIG1vbGVjdWxhciBjbG9jayBsaW5lLCBhbmQgdGhlbiBmaW5kIHRoZSBjb3JyZXNwb25kaW5nIHRpbWUgb24gdGhlIFggYXhpcy4=[Qq]
[c]IDUwMCBtaWxs aW9uIHllYXJz[Qq]
[f]IEV4Y2VsbGVudC4gSWYgdGhlcmUgYXJlIDI5IGFtaW5vIGFjaWQgZGlmZmVyZW5jZXMgYmV0d2VlbiBodW1hbiBhbmQgZnJ1aXQgZmx5IGN5dG9jaHJvbWUgYywgdGhlbiB0aGVpciBkaXZlcmdlbmNlIGRhdGUgc2hvdWxkIGJlIGFib3V0IDUwMCBtaWxsaW9uIHllYXJzIGFnbw==[Qq]
[/qwiz]
8. Horizontal gene transfer makes the phylogeny of early life a tangled web
The only image in Darwin’s Origin of Species is this phylogenetic tree—one of the first phylogenetic trees ever published.

If you start from “A” or “I” above you see two events: branching evolution, and extinction.
What Darwin didn’t know about is that throughout the history of life, and particularly during life’s earliest phases, lineages don’t only split apart. They sometimes fuse together, particularly at the genetic level.
The process by which this happens is called horizontal gene transfer. In horizontal gene transfer, genes are transferred from one species to another. This is very different from vertical gene transfer, in which genes are transmitted from parents to offspring.
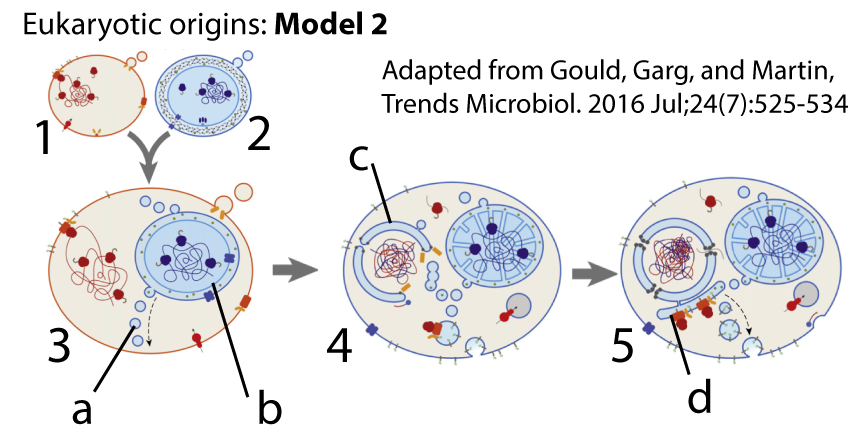
The most significant instance of horizontal gene transfer in life’s history involved the uptake of a bacterial cell by an archaeal host. The cell that was taken up evolved into the mitochondrion, and the endosymbiotic merger that resulted gave rise to the eukaryotes. Later, an early eukaryote engulfed a cyanobacteria, and the endosymbiotic merger that resulted led to the algae and plants. In both cases, there’s was widespread transfer of genes from mitochondria or chloroplasts into the genomes of their hosts.
In addition, horizontal gene transfer can involve any of the following mechanisms.
- Plasmids can transfer genes between bacteria— even bacteria of different species. This process is called conjugation.
- Through transformation, bacteria can take up foreign DNA from the environment and incorporate it into their genomes.
- Through transduction, viruses can move DNA from one species to another.
Through these mechanisms, and possibly others, animals, ranging from humans to rotifers, have taken up genes from bacteria. Plants have similarly taken up bacterial genes, as well as genes from other plant species.
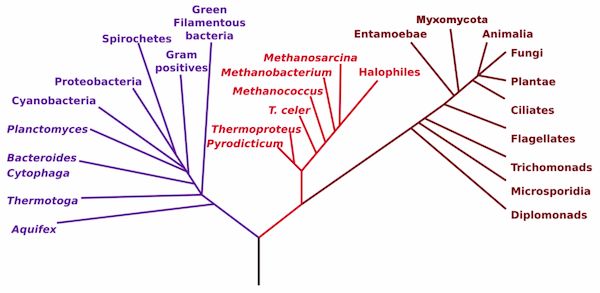
The takeaway is that this highest level phylogeny of the three domains in life is almost certainly incomplete.
So when you think about tree of life, it might be more accurate to think of this:
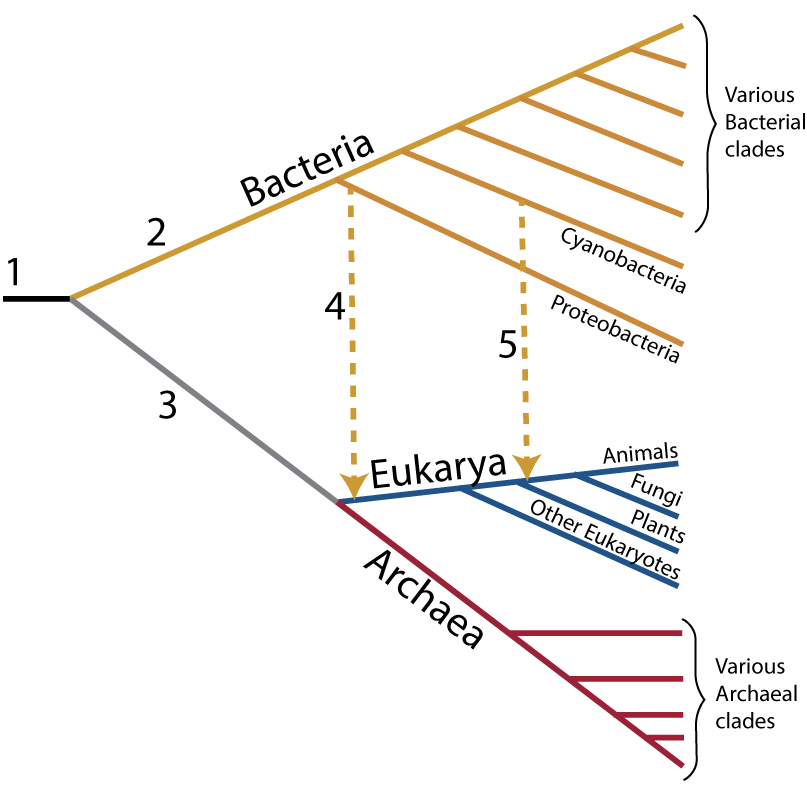
“1” shows the last universal ancestor of all living things. “2” is the lineage leading to bacteria, while 3 leads to Archaea and eukaryotes (“Eukarya”). Eukaryotes only emerge, however, after horizontal mergers that lead to all eukaryotes (“4” indicates the acquisition of mitochondria, creating the entire eukaryotic clade) and to plants (“5 indicates the acquisition of chloroplasts, leading to the plants).
But even that’s probably inadequate. Taking into account other instances of horizontal transfer, a more accurate tree of life might look like this.
![]()
The base is a seething mass of ancient cells, freely transferring genes with one another. The transfers that led to all eukaryotes are shown in the lateral line labeled “mitochondria.” A later lateral line labeled “plastids” leads to the plants and algae. Later, horizontal transfers through plasmids, viruses, and other mechanisms continue right up to the present day.
9. Phylogeny and Classification: Cumulative Quiz
[qwiz use_dataset=”Phylogeny Cumulative Quiz” random = “true” dataset_intro = “true” display_name=”Phylogeny and Classification” qrecord_id=”sciencemusicvideosMeister1961-Phylogeny-8_cumulative quiz”]
[h]Phylogeny and Classification: Cumulative Quiz
[i]
[/qwiz]