Community Ecology Student Learning guide (link opens a new tab)
Note from Mr. W: The section on the Simpson Biodiversity Index below was inspired by worksheets by Nick Peers-Dent on this webpage. Permission to adapt Mr. Peers-Dent’s work is pending.
1. What is Biodiversity?
Biodiversity is the variety of life. As we’ll see in this and the next tutorial, biodiversity is a key indicator of the health of populations, ecosystems, and the entire biosphere. As noted ecologist and entomologist Thomas Eisner said, “Biodiversity is the greatest treasure we have…Its diminishment is to be prevented at all costs.”
Maintaining biodiversity is one of the key challenges of this century. Let’s start by looking at biodiversity’s three components, and — as a preview of the next tutorial — look at some ways in which our planet’s biodiversity is under threat.
1a. Genetic Diversity
Look around you (or imagine some of the other people in your biology class, your school, or your community). You’re all human beings, but (unless you’re looking at your identical twin) you’re genetically distinct from one another. That’s genetic diversity within a population. To connect this to what you learned in population genetics, many of the gene loci in your population have at least two alleles, and often there are multiple alleles for each gene. There’s a lot of heterozygosity.
Genetic diversity is a good trait for a population to have. Genetic diversity leads to phenotypic diversity. The more phenotypic diversity, the more adaptable a population can be. By contrast, populations with very little genetic diversity — think of the cheetah, which we studied in our unit on population genetics — suffer multiple problems that increase their risk of extinction.
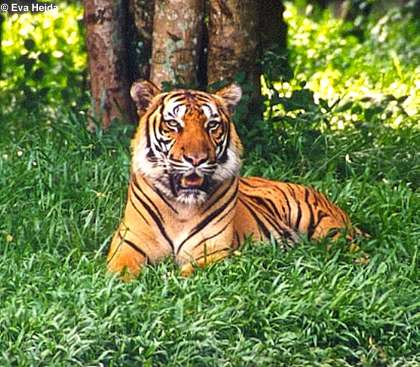
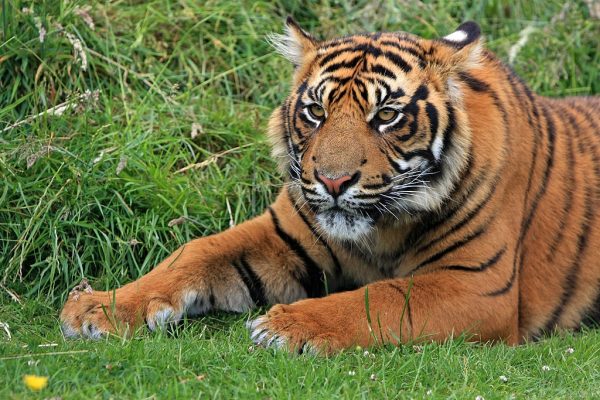
Genetic diversity also exists between populations. A species is typically spread out over a geographical range and divided into subpopulations. For example, tigers (Panthera tigris) consist of two recognized subspecies. Panthera tigris tigris, lives in mainland Asia. Panthera tigris sondaica, which is limited to the Sunda islands in Indonesia.
Based on genetic analysis, Panthera tigris tigris can be subdivided into two clades: a northern clade (which lives in Siberia) and a southern clade (which lives mostly in India). These clades are each subdivided into various branches, leading to the phylogenetic tree shown below. Loss of any of these clades would mean a loss of genetic diversity.

A lack of genetic diversity can be a problem for wild populations, and predispose a population to extinction. It can also be a problem in agriculture. As humans have selectively bred crops, we’ve made those crops extremely genetically uniform. Genetically uniform crops have less phenotypic diversity, making them more prone to parasites.
A catastrophic example of this occurred in the 1800s, during the Irish potato famine.
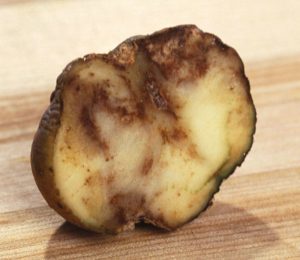
Potatoes are native to the Americas and were introduced into Ireland in 1589. A breed called the “Lumper” was found to be well adapted to Irish soils. Since potatoes can be propagated vegetatively, most of the Lumpers were clones of the original variety. In other words, there was no genetic diversity in the Irish potato crop.
In the 1840s, a fungus called Phytophthora infestans began to infest the Irish potato crop, causing a disease called “late blight.” The late blight infestation swept through Ireland, leading to widespread crop failures and famine.
A similar story can be told about bananas. Like potatoes, bananas are all clones. They’re grown from vegetative buds on their stems. In the 1920s, a fungus called Fusarium oxysporum started attacking what was at that time the main variety of bananas, nearly wiping out the crop worldwide. Bananas were only saved as a food crop because a new variety of bananas, the Cavendish, was found to be resistant, enabling banana cultivation to continue.
Recently, however, a new variety of F. oxysporum has emerged that is capable of attacking the Cavendish banana, and the crop is again under threat, causing losses of hundreds of millions of dollars. To learn more about the biology and history of bananas, read this article in the Conversation (the link opens a new tab).
1b. Species Diversity
Species diversity is the number of species in an ecosystem or the entire biosphere.
Throughout the history of life on Earth, new species have arisen through speciation, while other species have, for a variety of reasons, become extinct. If the rate of speciation is equal to the rate of extinction, then species diversity (globally or regionally) stays constant.
As we discussed in a previous module about extinction, it’s possible to calculate a background rate of extinction: how often extinctions normally occur. A widely quoted benchmark for the background extinction rate is 1 extinction/million species/year. So if Earth has 8.7 million species (PLOS Biology), then we would expect about 8 species to become extinct each year.
During mass extinctions, geological, astronomical, or biological events cause this background rate of extinction to skyrocket upward. During the last 200 years, human impact on the environment has created stressors that are driving large numbers of species toward extinction. As we’ll see in the next module, human activity is causing Earth’s sixth mass extinction.
Here’s a snapshot of some groups of vertebrates, showing how many of them are considered to be endangered (right on the edge of extinction) or threatened (a bit further from the edge). Source: International Union for Conservation of Nature.
| Group | Percent of species endangered or threatened with extinction |
| Amphibians | 40% |
| Mammals | 26% |
| Birds | 14% |
| Sharks and Rays | 33% |
Plants are also in danger. According to a 2020 report from the Kew Royal Botanic Gardens, 40% of plant species worldwide are threatened with extinction. This rate of extinction is up to 500 times the background rate in the pre-Anthropocene age.
1c. Ecosystem Diversity
Human impact is threatening the existence of entire ecosystems. Here are four examples.
-
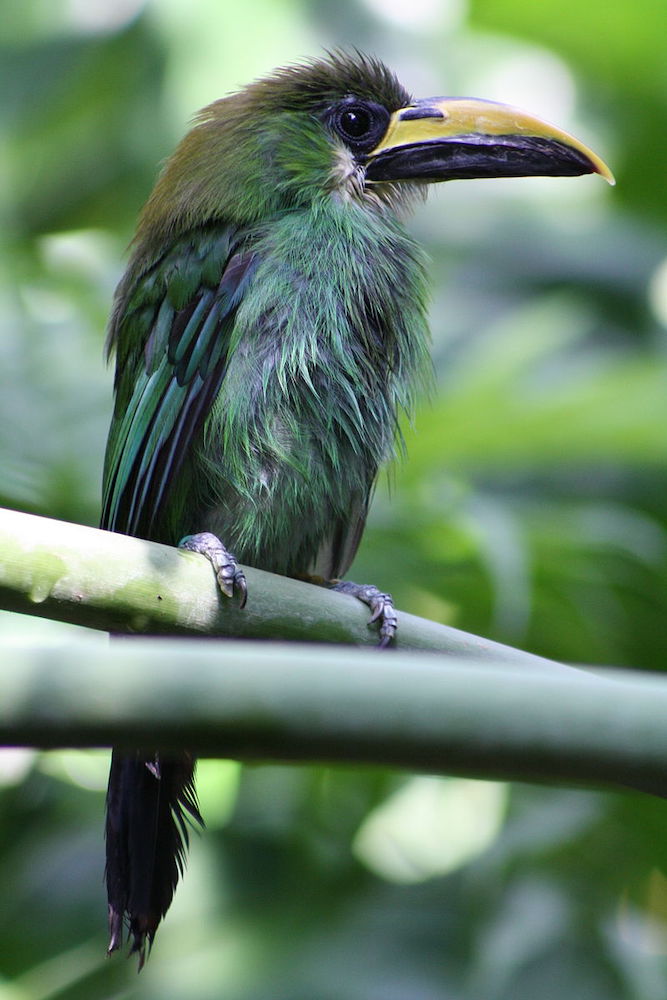
Like the Emerald Toucanet, almost 1/2 of the world’s birds live in rainforests Tropical rainforests — home to about 50% of the Earth’s species — are being cleared at the rate of 80,000 acres/day. (source: Scientific American). That’s 125 square miles. Imagine walking 11 miles, and seeing every tree cut down. That’s happening every day. In a year, that would be about the same as clearing all of Kentucky. - Tropical dry forests have between a half and all of the diversity of tropical rainforests. Unlike rainforests, these dry forests experience a seasonal drought, and that makes them home to a different array of species from what’s found in the neighboring rainforests. In Central America, only 2% of tropical dry forest habitat remains. There have been similar levels of deforestation in dry forests in Australia, Southeast Asia, and South America. (source: Chapter 14 of Biodiversity, Daniel Hanzen)
- Wetlands — including swamps, bogs, floodplains, and mangrove forests — are areas where water covers all or part of the surface either all year or during parts of the year. In the United States, 50% of the wetlands that were present in the early 1600s have been lost to development. (source: Wetlands Loss Since the Revolution, Fish and Wildlife Service).
-

Coral reefs provide a home for 25% of the world’s fish Coral Reefs, which harbor 25% of all marine species, are under stress from direct human impact (overfishing and fishing methods that destroy reef structure) and from ocean acidification. According to the US National Oceanic and Atmospheric Administration, up to 75% of Coral reefs are threatened.
2. Biodiversity: Why Should You Care?
Here are a couple of reasons why the loss of biodiversity is something that should concern us.
2a. Intrinsic Benefits
Biodiversity is intrinsically good, in and of itself. That’s a value statement, and there’s nothing objective about it. When I get to go to the California redwoods, my favorite spot on Earth, I feel like I’m home. I feel a sense of connection to the forest around me, and to the entire universe.
The biologist E.O. Wilson has described this feeling as biophilia (“bio” means life; “-philia” means love of). His biophilia hypothesis claims that biophilia is an innate tendency that drives people to affiliate with nature. “The natural world is the refuge of the spirit,” Wilson writes. “Into wilderness people travel in search of new life and wonder.”
Do we need a reason to desire a world in which elephants roam free, or where condors soar overhead? Just imagine a world without hummingbirds or sea stars. A world with less biodiversity is a much poorer place. And, because of extinctions and changes that have already happened, our world already is a poorer place.
2b. Direct Benefits of Biodiversity to Humanity
Here are some direct benefits that humans get from preserving biodiversity.
- Pharmaceuticals. Every lineage of life embodies 3.8 billion years of biochemical experimentation. The compounds that have evolved could have properties that make them useful as drugs. Every time a patch of rainforest is destroyed or a species gets driven to extinction, a still-to-be-discovered medicine could be disappearing. Some drugs that have been discovered from natural sources include
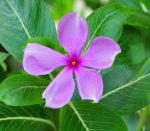
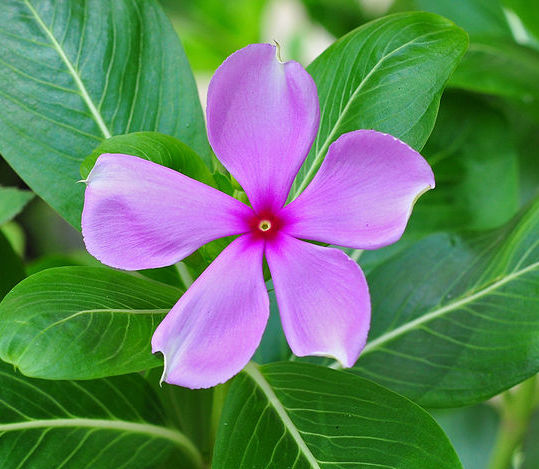
Madagascar’s rosy periwinkle is the source of two anti-cancer drugs - Aspirin (derived originally from the bark of willow trees),
- A variety of antibiotics (penicillin is produced by fungi; streptomycin and tetracycline are from soil bacteria),
- vinblastine and vincristine, two anti-cancer drugs derived from the rosy periwinkle.
- New crops (or genetic diversity for existing crops). This is the same argument as above but applied to food. Every one of our staple foods was once a wild plant. Wild relatives of rice, wheat corn, etc. are a valuable source of genetic diversity that can be used by plant breeders and genetic engineers to bring new traits into existing crops.
2c. Ecosystem Services
Now consider ecosystem services. These are the benefits people obtain from intact ecosystems. These services include
- Regulating the composition of the air. Take a breath. The composition of the gases you just inhaled was regulated (at no cost to anybody) by geological and biological processes that absorb carbon dioxide, provide oxygen, and create the ozone layer to protect life from ultraviolet radiation.
- Water regulation and supply. Take a drink of water. While almost all water in the U.S. is filtered and chemically treated before being piped to homes, it originates from geological, hydrological, and biological processes that fill the aquifers, rivers, lakes, and reservoirs which make up our water supply. That same water supply is also the basis for much of our agricultural and industrial economy. If these processes were disrupted and we had to use water that we purified from the oceans, the cost would be astronomical.
- Pollination: Eat an apple. Much of our food supply is based on insect pollinators that move gametes from one flower to the next.
Other ecosystem services include
- Pest control: bats and birds consume insects whose numbers would otherwise spiral out of control.
- Nutrient Cycling: nitrogen-fixing bacteria in the soil and the roots of legumes enrich the soil by nitrogen fixation.
- Cultural services: the scientific, aesthetic, educational, artistic, and spiritual value of wild lands and nature.
How much are these services worth? In 1997, a team led by Robert Costanza estimated that the value of these services was worth $33 trillion/year. That was almost twice the value of the world’s gross national product in 1997 (which was about $18 trillion).
3. Biodiversity: Checking Understanding
[qwiz qrecord_id=”sciencemusicvideosMeister1961-Biodiversity, Checking Understanding”]
[h]Biodiversity: Checking Understanding
[i]Biohaiku
These three components
Genes, species, ecosystems
Life’s diversity
[q] The variety of life: [hangman].
[c]IGJpb2RpdmVyc2l0eQ==[Qq]
[q] If a gene pool has many gene loci with multiple alleles, then we could say that the population has a lot of [hangman] diversity.
[c]IGdlbmV0aWM=[Qq]
[q] Genetic diversity leads to [hangman] (hint: begins with “p”) diversity. That’s important to natural selection because it makes a population capable of [hangman] to environmental change.
[c]IHBoZW5vdHlwaWM=[Qq]
[c]IGFkYXB0aW5n[Qq]
[q]The Irish potato famine shows how [hangman] diversity in food crops can be important to our system of [hangman] (hint: begins with “a”). If crops lack this type of diversity, they can be wiped out by [hangman] infections, which is exactly what happened in Ireland in the 1840s.
[c]Z2VuZXRpYw==[Qq]
[c]YWdyaWN1bHR1cmU=[Qq]
[c]cGFyYXNpdGlj[Qq]
[q]Here’s an easy question: What kind of diversity is defined by the number of species in a habitat, ecosystem, or entire planet: [hangman] diversity
[c]c3BlY2llcw==[Qq]
[q]This ecosystem is home to 50% of the Earth’s species. It’s being cleared at a rate of 80,000 acres/day: tropical [hangman].
[c]cmFpbmZvcmVzdA==[Qq]
[q]This ecosystem, in which the land is partially or completely covered by water at various times of the year, has been reduced by 50% in the United States: [hangman].
[c]d2V0bGFuZHM=[Qq]
[q]This marine ecosystem harbors 25% of all marine species. It’s under threat from destructive fishing methods, and ocean acidification (associated with human carbon dioxide emissions): [hangman] [hangman].
[c]Y29yYWw=[Qq]
[c]cmVlZnM=[Qq]
[q multiple_choice=”true”]The Earth is thought to have about ____________ species
[c]NTAwLDAwMA==[Qq]
[f]Tm8uIFlvdSYjODIxNztyZSB3YXkgdG9vIGxvdy4=[Qq]
[c]YmV0d2VlbiBvbmUgYW5kIHR3byBtaWxsaW9u[Qq]
[f]Tm8uIFRoYXQgc291bmRzIGxpa2UgYSBsb3QsIGJ1dCB5b3UmIzgyMTc7cmUgc3RpbGwgdG9vIGxvdy4=[Qq]
[c]YmV0d2VlbiBlaWdodCBh bmQgbmluZSBtaWxsaW9u[Qq]
[f]VGhhdCYjODIxNztzIHJpZ2h0LiBUaGUgbnVtYmVyIG9mIHNwZWNpZXMgb24gRWFydGggaGFzIGJlZW4gZXN0aW1hdGVkIHRvIGJlIGFib3V0IDguNyBtaWxsaW9uLg==[Qq]
[q multiple_choice=”true”]What percent of amphibian species are threatened with extinction?
[c]NSU=[Qq]
[f]Tm8uIFlvdSYjODIxNztyZSB3YXkgdG9vIGxvdy4=[Qq]
[c]ND Al[Qq]
[f]TmljZSAoYnV0IHNhZCEpIFRoZSBudW1iZXIgb2YgYW1waGliaWFucyB0aHJlYXRlbmVkIHdpdGggZXh0aW5jdGlvbiBpcyBhYm91dCA0MCUu[Qq]
[c]ODAl[Qq]
[f]Tm8uIFRoYXQmIzgyMTc7cyB0b28gaGlnaC4=[Qq]
[q]The idea that nature is valuable in and of itself relates to the [hangman] value of biodiversity.
[c]aW50cmluc2lj[Qq]
[q]The fact that many potential medicines and crops are waiting to be discovered in natural systems is related to the [hangman] benefits of biodiversity.
[c]ZGlyZWN0[Qq]
[q]Regulation of the atmosphere, provision of water, and pollination are all examples of [hangman] [hangman].
[c]ZWNvc3lzdGVt[Qq]
[c]IHNlcnZpY2Vz[Qq]
[q mutiple_choice=”true”]The current rate of extinction is
[c]dGhlIHJlc3VsdCBvZiBuYXR1cmFsIHByb2Nlc3NlcyBvdmVyIHdoaWNoIGh1bWFucyBoYXZlIG5vIGNvbnRyb2w=[Qq]
[f]Tm8uIHdoaWxlIHRoYXQgd2FzIHRydWUgb2Ygb3RoZXIgbWFzcyBleHRpbmN0aW9ucywgdGhhdCYjODIxNztzIG5vdCB0aGUgY2FzZSB0b2RheS4=[Qq]
[c]dHJhY2VhYmxlIHRvIG h1bWFuIGFjdGl2aXR5[Qq]
[f]WWVzLiBUb2RheSYjODIxNztzIHNpeHRoIGV4dGluY3Rpb24gaXMgYW50aHJvcG9nZW5pYzogY2F1c2VkIGJ5IGh1bWFucy4=[Qq]
[c]c2xvd2VyIHRoYW4gYXQgYW55IHJlY29yZGVkIHRpbWUgaW4gaHVtYW4gaGlzdG9yeQ==[Qq]
[f]Tm8uIEl0JiM4MjE3O3MgbXVjaCBmYXN0ZXIu[Qq]
[q mutiple_choice=”true”]The type of diversity that involves the variety of communities and habitats is
[c]Z2VuZXRpYyBkaXZlcnNpdHk=[Qq]
[f]Tm8uIEdlbmV0aWMgZGl2ZXJzaXR5IGlzIG1vcmUgcmVsYXRlZCB0byB0aGUgZXh0ZW50IG9mIGhldGVyb3p5Z29zaXR5IGluIGEgZ2VuZSBwb29sLg==[Qq]
[c]c3BlY2llcyBkaXZlcnNpdHk=[Qq]
[f]Tm8uIFNwZWNpZXMgZGl2ZXJzaXR5IGlzIHRoZSBudW1iZXIgb2Ygc3BlY2llcyBpbiBhIHJlZ2lvbiwgZWNvc3lzdGVtLCBvciBwbGFuZXQu[Qq]
[c]ZWNvc3lzdGVtIG RpdmVyc2l0eQ==[Qq]
[f]WWVzLiBUaGUgdmFyaWV0eSBvZiBjb21tdW5pdGllcyBhbmQgaGFiaXRhdHMgcmVsYXRlcyB0byBlY29zeXN0ZW0gZGl2ZXJzaXR5Lg==[Qq]
[/qwiz]
4. Species Diversity: A closer look
Species diversity, and how it can be measured, is the focus of the rest of this tutorial. It involves two components: species richness, and species evenness. See if you can figure out what these concepts mean by completing the exercise below.
[qwiz style=”width: 650px !important; min-height: 400px !important;” random=”false” qrecord_id=”sciencemusicvideosMeister1961-Introducing Species Diversity”]
[h]Introducing Species Diversity
[i]
[q] Consider 3 communities of wildflowers, shown below as Communities A, B, and C. Think about what it means to be rich, and determine which of the communities shown below has the lowest species richness (enter A, B, or C)?
[textentry single_char=”true”]
[c]IE E=[Qq]
[f]IE5pY2Ugam9iLiBDb21tdW5pdHkgQSBoYXMgdGhlIGxvd2VzdCBzcGVjaWVzIHJpY2huZXNzLiBUaGF0JiM4MjE3O3MgYmVjYXVzZSA=c3BlY2llcyByaWNobmVzcw==IGlzIGEgbWVhc3VyZSBvZiB0aGUgbnVtYmVyIG9mIHNwZWNpZXMgaW4gYSBjb21tdW5pdHkuIENvbW11bml0eSBBIGhhcyAzIHNwZWNpZXMgb2Ygd2lsZGZsb3dlcnMuwqAgQ29tbXVuaXRpZXMgQiBhbmQgQyBlYWNoIGhhdmUgNC4gSGVuY2UgQSBoYXMgdGhlIGxvd2VzdCByaWNobmVzcy4=[Qq]
[c]IEVudGVyIHdvcmQ=[Qq]
[c]ICo=[Qq]
[f]IE5vLiA=U3BlY2llcyByaWNobmVzcw==IGlzIGEgbWVhc3VyZSBvZiB0aGUgbnVtYmVyIG9mIHNwZWNpZXMgaW4gYSBjb21tdW5pdHkuIENvdW50IHRoZSBudW1iZXIgb2Ygc3BlY2llcyBpbiBlYWNoIGNvbW11bml0eSwgYW5kIGNob29zZSBhIGRpZmZlcmVudCBhbnN3ZXIu[Qq]
[q] One meaning of the word “even” is “equal in value.” Keeping that definition in mind, which of the communities shown below has the lowest species evenness?
[textentry single_char=”true”]
[c]IE M=[Qq]
[f]IEF3ZXNvbWUuIENvbW11bml0eSBDIGhhcyB0aGUgbG93ZXN0IHNwZWNpZXMgZXZlbm5lc3MuIFRoYXQmIzgyMTc7cyBiZWNhdXNlIA==c3BlY2llcyBldmVubmVzcw==IGlzIGEgbWVhc3VyZSBvZiBob3cgc2ltaWxhciB0aGUgc3BlY2llcyBpbiBhIGNvbW11bml0eSBhcmUgaW4gdGhlaXIgcmVsYXRpdmUgYWJ1bmRhbmNlLiBJbiBDb21tdW5pdHkgQywgdGhlcmUgYXJlIDkgaW5kaXZpZHVhbHMgb2Ygc3BlY2llcyAxOyBhbmQgMSBpbmRpdmlkdWFsIGZyb20gc3BlY2llcyAyLCAzLCBhbmQgNC4gVGhlIG90aGVyIGNvbW11bml0aWVzIGhhdmUgYSBtdWNoIG1vcmUgZXZlbiBzcHJlYWQgb2YgYWJ1bmRhbmNlIGZyb20gc3BlY2llcyB0byBzcGVjaWVzIChhbmQgYXJlIHRoZXJlZm9yZSBtb3JlIGV2ZW4pLg==[Qq]
[c]IEVudGVyIHdvcmQ=[Qq]
[c]ICo=[Qq]
[f]IE5vLiA=U3BlY2llcyBldmVubmVzcyBpcyBhIG1lYXN1cmUgb2YgaG93IHNpbWlsYXIgdGhlIHNwZWNpZXMgaW4gYSBjb21tdW5pdHkgYXJlIGluIHRoZWlyIHJlbGF0aXZlIGFidW5kYW5jZS7CoA==IENvdW50IHRoZSBudW1iZXIgb2YgZWFjaCB0eXBlIG9mIGZsb3dlciBpbiBlYWNoIGNvbW11bml0eSwgeW91JiM4MjE3O2xsIGZpbmQgdGhlIGFuc3dlci4=[Qq]
[q]The number of species in a community is that community’s species [hangman]. That’s why community A, with 3 species, is the community that’s lowest for this measure.
[c]cmljaG5lc3M=[Qq]
[q]The relative similarity of the number of individuals of each species in a community is referred to as species [hangman]. That’s why community C, with so many more individuals of species 1 than individuals of species 2, 3, or 4, is the community that’s lowest for this measure.
[c]ZXZlbm5lc3M=[Qq]
[q multiple_choice = “true”]To determine which community has the highest overall species diversity, you need to plug numbers into a formula. But knowing what you know about species richness and species evenness, which community would you guess has the highest species diversity?
[c]QQ==[Qq]
[f]Tm8uIEl0JiM4MjE3O3Mgbm90IEEuIEZvciBub3csIChiZWZvcmUgd2UmIzgyMTc7dmUgbGVhcm5lZCB0aGUgZm9ybXVsYSksIGZpbmQgdGhlIGNvbW11bml0eSB0aGF0JiM4MjE3O3MgaGlnaGVzdCBpbiBib3RoIHNwZWNpZXMgcmljaG5lc3MgYW5kIGV2ZW5uZXNzLg==[Qq]
[c]Qg ==[Qq]
[f]RmFidWxvdXMuIEIgaXMgdGhlIGNvbW11bml0eSB0aGF0JiM4MjE3O3MgaGlnaGVzdCBpbiBib3RoIHNwZWNpZXMgcmljaG5lc3M=IGFuZCA=ZXZlbm5lc3M=LCB3aGljaCBnaXZlcyBpdCB0aGUgaGlnaGVzdCBzcGVjaWVzIA==[Qq]diversity. Later, we’ll see how to determine species diversity mathematically.
[c]Qw==[Qq]
[f]Tm8uIEMgaGFzIGhpZ2ggc3BlY2llcyByaWNobmVzcywgYnV0IGxvdyBldmVubmVzcy4gRm9yIG5vdywgKGJlZm9yZSB3ZSYjODIxNzt2ZSBsZWFybmVkIHRoZSBmb3JtdWxhKSwgZmluZCB0aGUgY29tbXVuaXR5IHRoYXQmIzgyMTc7cyBoaWdoZXN0IGluIGJvdGggc3BlY2llcyByaWNobmVzcyBhbmQgZXZlbm5lc3Mu[Qq]
[q]Before going on, make sure you have a good understanding of these two components of species diversity.
- Species richness: the number of species in an area under study.
- Species evenness: how evenly distributed the members of any one species are in their numbers.
[x]
You’ve learned above that community A has the lowest species richness, and community C has the lowest species evenness. But which community, A or C, has the higher species diversity? For that, you need a formula, and that’s what we’ll address below.
[/qwiz]
5. Understanding the Simpson Biodiversity Index
Ecologists have combined measures of species richness and species evenness to create a variety of indices to measure a community’s overall species diversity. In this module, we’ll learn how to use one of these indices: Simpson’s Diversity Index.
The formula has a couple of variations. We’re going to go with the one that’s on the College Board’s AP Bio exam formula sheet. Here it is:
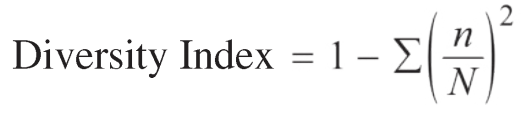
In this formula, n represents the total number of organisms of each species, and N represents the total number of organisms in the entire community. The Greek letter ∑ means “the sum of.”
The advantage of expressing the formula in the way shown above is that higher values (values closer to 1) mean more diversity, and lower values (closer to 0) mean less diversity. That’s pretty easy to understand. But, truth be told, the expression used by the College Board is the “diversity index difference.” It’s the diversity value subtracted from one. The only time this will make a difference will be if you talk to someone who’s not taking an AP Bio class (or when you’re in future biology classes). If you’re already in one of those classes, please make sure that you understand diversity in the way your instructor is teaching it.
Use the quiz below to help you solidify your understanding of what high and low species diversity means in a biological community.
[qwiz qrecord_id=”sciencemusicvideosMeister1961-High and Low biodiversity”]
[h]High and Low Biodiversity
[q labels = “top”]Low species diversity means:”
- There are relatively _______ successful species in this community.
- The environment might support only a small number of ecological ____________.
- The environment might be stressful, and difficult for a species to ____________ to.
- An environmental shift might force the few species in this environment to become locally ___________.
- A diagram of this community’s food web would be relatively ____________.
[l]adapt
[fx] No, that’s not correct. Please try again.
[f*] Good!
[l]extinct
[fx] No. Please try again.
[f*] Good!
[l]few
[fx] No. Please try again.
[f*] Correct!
[l]niches
[fx] No. Please try again.
[f*] Great!
[l]simple
[fx] No. Please try again.
[f*] Great!
[q labels = “top”]High species diversity means:
- Many available ecological ______________.
- A large number of ______________ species.
- An ecosystem that can remain ___________ in the face of environmental fluctuation.
- A diagram of this community’s food web would be ______________.
[l]complex
[fx] No, that’s not correct. Please try again.
[f*] Correct!
[l]niches
[fx] No. Please try again.
[f*] Great!
[l]stable
[fx] No. Please try again.
[f*] Correct!
[l]successful
[fx] No, that’s not correct. Please try again.
[f*] Correct!
[/qwiz]
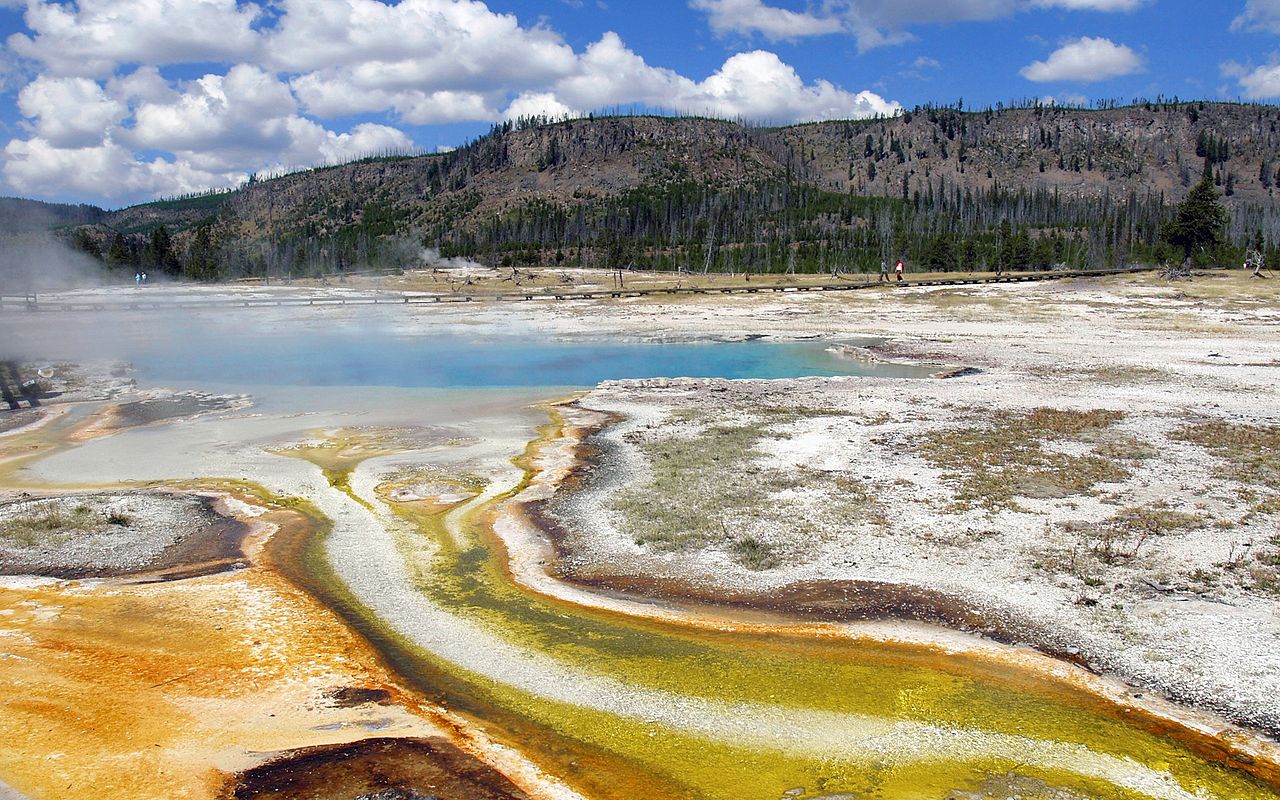
It should be noted that some ecosystems have low levels of biodiversity, but are still “healthy.” Consider the geothermally heated pools in Yellowstone National Park. In this extremely hot water, where temperatures range between 32° and 79° C (90° – 174° F), you’d find only a handful of species of bacteria and archaea. But that’s about as diverse as things can get in this extreme environment.
The thing to watch for as we try to assess the health of a biological community is whether the biodiversity has fallen from an earlier baseline. On the other hand, a rise in biodiversity can be a sign that measures designed to increase the health of an ecosystem (such as the reintroduction of wolves into Yellowstone) have been successful.
6. Calculating Biodiversity using the Simpson Diversity Index Formula
To learn how to calculate biodiversity, let’s walk through an example. You’re comparing biodiversity in three communities. In the table below “Sp.” stands for species, and C1, C2, and C3 are the three communities.
In each community, the same 10 species are potentially present, but in different numbers (including 0). The total number of individual organisms in each community adds up to 100.
| Sp. A | Sp. B | Sp. C | Sp. D | Sp. E | Sp. F | Sp. G | Sp. H | Sp. I | Sp. J | Total | |
| C1 | 12 | 9 | 9 | 10 | 9 | 11 | 10 | 11 | 10 | 9 | 100 |
| C2 | 68 | 9 | 3 | 4 | 1 | 3 | 4 | 3 | 2 | 3 | 100 |
| C3 | 32 | 36 | 32 | 0 | 0 | 0 | 0 | 0 | 0 | 0 | 100 |
Our formula is:
For any operation like this, I like to create tables (but this can also be done on a scientific calculator). Find out how your instructor wants you to do it, and to what degree they want you to show your work.
We’ll start with community 1.
Step 1: Set up your table. Fill in “n,” which is the number of individuals of each species.
| Sp. A | Sp. B | Sp. C |
Sp. D | Sp. E |
Sp. F |
Sp. G | Sp. H | Sp. I |
Sp. J |
TOTAL (N) | |
| n | 12 | 9 | 9 | 10 | 9 | 11 | 10 | 11 | 10 | 9 | 100 |
| n/N | |||||||||||
| (n/N)2 |
Step 2: For each species, divide n by N (the total number of individuals in the community). In this case, N = 100.
| Sp. A |
Sp. B |
Sp. C |
Sp. D | Sp. E |
Sp. F |
Sp. G | Sp. H |
Sp. I |
Sp. J |
TOTAL (N) | |
| n | 12 | 9 | 9 | 10 | 9 | 11 | 10 | 11 | 10 | 9 | 100 |
| n/N | 0.12 | 0.09 | 0.09 | 0.1 | 0.09 | 0.11 | 0.1 | 0.11 | 0.1 | 0.09 | |
| (n/N)2 |
Step 3: For each species, take the value of n/N and square it. In other words, calculate (n/N)2.
| Sp. A |
Sp. B |
Sp. C |
Sp. D | Sp. E |
Sp. F |
Sp. G | Sp. H |
Sp. I |
Sp. J |
TOTAL (N) | |
| n | 12 | 9 | 9 | 10 | 9 | 11 | 10 | 11 | 10 | 9 | 100 |
| n/N | 0.12 | 0.09 | 0.09 | 0.1 | 0.09 | 0.11 | 0.1 | 0.11 | 0.1 | 0.09 | |
| (n/N)2 | 0.0144 | 0.0081 | 0.0081 | 0.01 | 0.0081 | 0.0121 | 0.01 | 0.0121 | 0.01 | 0.0081 |
Step 4: Add together all the values of (n/N)2 to get ∑(n/N)2.
|
Species |
Species B |
C | C | E | F | G | H | I | J | TOTAL (N) | |
| n | 12 | 9 | 9 | 10 | 9 | 11 | 10 | 11 | 10 | 9 | 100 |
| n/N | 0.12 | 0.09 | 0.09 | 0.1 | 0.09 | 0.11 | 0.1 | 0.11 | 0.1 | 0.09 | |
| (n/N)2 | 0.0144 | 0.0081 | 0.0081 | 0.01 | 0.0081 | 0.0121 | 0.01 | 0.0121 | 0.01 | 0.0081 | 0.101 |
Step 5: subtract ∑(n/N)2 from 1. (That’s because we’re using the College Board’s formula, which is the Diversity Index Difference).
1 – 0.101 = 0.899. Remember that for this formulation of the Simpson Biodiversity index, values closer to 1 indicate higher biodiversity, while values closer to 0 represent lower biodiversity.
7. Simpson’s Biodiversity Index. Guided Practice
Now calculate the species diversity for community 2. Try to do it on your own, but I’ll break it down step by step in the set of cards below.
[qwiz style=”width: 800px !important; min-height: 400px !important;” qrecord_id=”sciencemusicvideosMeister1961-Calculating Biodiversity, Guided Practice”]
[h]Calculating Species Diversity: Example 2
[q]Step 1: Set up your table. Fill in “n,” which is the number of individuals of each species.
| Sp. A | Sp. B | Sp. C |
Sp. D | Sp. E |
Sp. F |
Sp. G | Sp. H | Sp. I |
Sp. J |
TOTAL (N) | |
| n | 68 | 9 | 3 | 4 | 1 | 3 | 4 | 3 | 2 | 3 | 100 |
| n/N | |||||||||||
| (n/N)2 |
[q]Step 2: For each species, divide n by N (the total number of individuals in the community). In this case, N = 100.
| Sp. A |
Sp. B |
Sp. C |
Sp. D | Sp. E |
Sp. F |
Sp. G | Sp. H |
Sp. I |
Sp. J |
TOTAL (N) | |
| n | 68 | 9 | 3 | 4 | 1 | 3 | 4 | 3 | 2 | 3 | 100 |
| n/N | 0.68 | 0.09 | 0.03 | 0.04 | 0.01 | 0.03 | 0.04 | 0.03 | 0.02 | 0.03 | |
| (n/N)2 |
[q]Step 3: For each species, take the value of n/N and square it. In other words, calculate (n/N)2.
| Sp. A |
Sp. B |
Sp. C |
Sp. D | Sp. E |
Sp. F |
Sp. G | Sp. H |
Sp. I |
Sp. J |
TOTAL (N) | |
| n | 68 | 9 | 3 | 4 | 1 | 3 | 4 | 3 | 2 | 3 | 100 |
| n/N | 0.68 | 0.09 | 0.03 | 0.04 | 0.01 | 0.03 | 0.04 | 0.03 | 0.02 | 0.03 | |
| (n/N)2 | 0.4624 | 0.0081 | 0.0009 | 0.0016 | 0.0001 | 0.0009 | 0.0016 | 0.0009 | 0.0004 | 0.0009 |
[q]Step 4: Add together all the values of (n/N)2.
| Sp. A |
Sp. B |
Sp. C |
Sp. D | Sp. E |
Sp. F |
Sp. G | Sp. H |
Sp. I |
Sp. J |
TOTAL (N) | |
| n | 68 | 9 | 3 | 4 | 1 | 3 | 4 | 3 | 2 | 3 | 100 |
| n/N | 0.68 | 0.09 | 0.03 | 0.04 | 0.01 | 0.03 | 0.04 | 0.03 | 0.02 | 0.03 | |
| (n/N)2 | 0.4624 | 0.0081 | 0.0009 | 0.0016 | 0.0001 | 0.0009 | 0.0016 | 0.0009 | 0.0004 | 0.0009 | 0.4778 |
[q]Step 5: subtract ∑(n/N)2 from 1.
1 – 0.4778 = 0.5222
[/qwiz]
Now calculate the species diversity of community 3. Clicking “show me the answer” will show you the completed table with the calculated diversity index.
[qwiz style=”width: 800px !important; min-height: 400px !important;” qrecord_id=”sciencemusicvideosMeister1961-Calculating Diversity, Example 3″]
[h]Calculating Species Diversity: Example 3
[q]Step 1: Set up your table. Fill in “n,” which is the number of individuals of each species.
| Sp. A | Sp. B | Sp. C |
Sp. D | Sp. E |
Sp. F |
Sp. G | Sp. H | Sp. I |
Sp. J |
TOTAL (N) | |
| n | 32 | 36 | 32 | 0 | 0 | 0 | 0 | 0 | 0 | 0 | 100 |
[c]IFtzaG93X21lX3Bs YWNlaG9sZGVyXQ==[Qq]
[f]
Cg==U3RlcHMgMi00
[Qq]| Sp. A |
Sp. B |
Sp. C |
Sp. D | Sp. E |
Sp. F |
Sp. G | Sp. H |
Sp. I |
Sp. J |
TOTAL (N) | |
| n | 32 | 36 | 32 | 0 | 0 | 0 | 0 | 0 | 0 | 0 | 100 |
| n/N | 0.32 | 0.36 | 0.32 | 0 | 0 | 0 | 0 | 0 | 0 | 0 | |
| (n/N)2 | 0.1024 | 0.1296 | 0.1024 | 0 | 0 | 0 | 0 | 0 | 0 | 0 | 0.3344 |
Step 5: subtract ∑(n/N)2 from 1.
1 – 0.3344 = 0.6656
[/qwiz]
8. Simpon’s Biodiversity Index: Reflection
Now that we’ve calculated the species diversity for each community, let’s step back and think about what we’ve found.
[qwiz style=”width: 800px !important; min-height: 400px !important;” qrecord_id=”sciencemusicvideosMeister1961-Calculating Diversity, Reflection”]
[h]Calculating biodiversity: Reflection
[i]
[q]Here’s the data we started with. Note that I’ve filled in the Diversity index difference in the column on the far right.
| Sp. A | Sp. B | Sp. C | Sp. D | Sp. E | Sp. F | Sp. G | Sp. H | Sp. I |
Sp. J | Total | Diversity index difference | |
| C1 | 12 | 9 | 9 | 10 | 9 | 11 | 10 | 11 | 10 | 9 | 100 | 0.899 |
| C2 | 68 | 9 | 3 | 4 | 1 | 3 | 4 | 3 | 2 | 3 | 100 | 0.522 |
| C3 | 32 | 36 | 32 | 0 | 0 | 0 | 0 | 0 | 0 | 0 | 100 | 0.6656 |
It makes sense that community 1 has the highest overall species [hangman] because it has the highest number of species, also known as “species [hangman].” All of the species in community 1 are more or less equal in abundance, meaning that community 1 also has the highest species [hangman].
[c]ZGl2ZXJzaXR5[Qq]
[c]cmljaG5lc3M=[Qq]
[c]ZXZlbm5lc3M=[Qq]
[q]Interestingly, even though community 3 is the [hangman] in terms of species [hangman], its high level of [hangman] puts it above community 2, which has high species [hangman] but low species [hangman].
| Sp. A | Sp. B | Sp. C | Sp. D | Sp. E | Sp. F | Sp. G | Sp. H | Sp. I |
Sp. J | Total | Diversity index (difference) | |
| C1 | 12 | 9 | 9 | 10 | 9 | 11 | 10 | 11 | 10 | 9 | 100 | 0.899 |
| C2 | 68 | 9 | 3 | 4 | 1 | 3 | 4 | 3 | 2 | 3 | 100 | 0.522 |
| C3 | 32 | 36 | 32 | 0 | 0 | 0 | 0 | 0 | 0 | 0 | 100 | 0.6656 |
[c]bG93ZXN0[Qq]
[c]cmljaG5lc3M=[Qq]
[c]ZXZlbm5lc3M=[Qq]
[c]cmljaG5lc3M=[Qq]
[c]ZXZlbm5lc3M=[Qq]
[/qwiz]
9. Simpson Index Practice Problems
For each of the problems below, calculate the answer on your own. Then click “Show the Answer” to see if you got it right.
[qwiz style=”width: 800px !important; min-height: 400px !important;” qrecord_id=”sciencemusicvideosMeister1961-Simpson’s Index Practice Problems”]
[h]Simpson Index Diversity practice problems
[q]PROBLEM 1: An ecologist in a study area in Redwood National Park gathers the following data.
| Redwoods | Douglas Firs | Western Hemlocks | Sitka Spruce |
| 84 | 90 | 7 | 42 |
Calculate the diversity index difference for this patch of forest.
[c]IFtzaG93X21lX3Bs YWNlaG9sZGVyXQ==[Qq]
[f]
Cg==| [Qq] | Redwoods | Douglas Firs | Western Hemlocks | Sitka Spruce | ||
| n | 84 | 90 | 7 | 42 | 223 | N |
| n/N | 0.38 | 0.40 | 0.03 | 0.19 | ||
| (n/N)2 | 0.14 | 0.16 | 0.00 | 0.04 | 0.34 | D |
Diversity index different = 1 – D = 1 – 0.34 = 0.66
[q]PROBLEM 2: An African Park contains the following array of mammals.
| Hyenas | Gazelles | Giraffes | Lions | Elephants | Wildebeest |
| 84 | 90 | 7 | 42 | 15 | 115 |
Calculate the diversity index for the mammals in this park.
[c]IFtzaG93X21lX3Bs YWNlaG9sZGVyXQ==[Qq]
[f]
Cg==| [Qq] | Hyenas | Gazelles | Giraffes | Lions | Elephants | Wildebeest | ||
| n | 84 | 90 | 7 | 42 | 15 | 115 | 353 | N |
| n/N | 0.24 | 0.25 | 0.02 | 0.12 | 0.04 | 0.33 | ||
| (n/N)2 | 0.06 | 0.07 | 0.0004 | 0.01 | 0.002 | 0.11 | 0.24 | D |
Diversity index difference = 1 – D = 1 – 0.14 = 0.76
[/qwiz]
Updated, for sync, 8/10/20
10. What’s next?
This tutorial ends this module on Community Ecology. Please choose another module, or use this link to return to the community ecology main menu.