Looking for a student learning guide? It’s linked in the main menu for your course. Use the “Courses” menu above.
1. Introduction
With a few exceptions — sessile animals like barnacles, sea anemones, and corals — moving from one place to another is a key part of what it means to be an animal. Throughout the day, animals move in search of food, shelter, and mates; and to avoid danger from predators or exposure to the elements. During migration, a population of animals interrupts its daily movement pattern to travel in a persistent direction to a new habitat. Often, these movements are seasonal and involve moving toward a breeding site.
Migratory behavior is widely dispersed among the members of the animal kingdom and is found in many species from groups as diverse as insects, crabs, birds, hoofed mammals, bats, whales, and fish.
2. Arctic Terns
The Arctic tern might be the Earth’s champion migrator. Every year, this tern migrates from the Arctic to Antarctica, flying from pole to pole to catch the long days of summer in each hemisphere. Each trip South or North is at least 19,000 kilometers (12,000 miles) each way, but these birds often follow the coastlines of the continents, meaning that a bird’s actual yearly flying distance can be much longer.
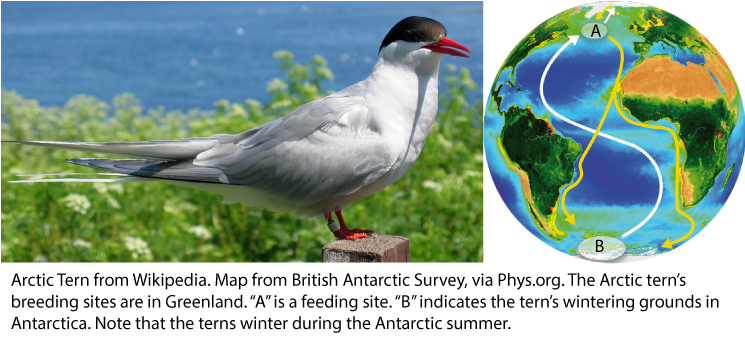
How do we know? Traditionally, the activity of individual birds has been followed by placing rings on their legs, releasing them, and then recapturing them. More recently, scientists have used lightweight, solar-powered tracking devices (such as the one shown on the right). One group of terns that were tracked flew 90,000 kilometers in one year (56,000 miles): more than twice the Earth’s circumference.
3. Learning to Navigate by the Stars
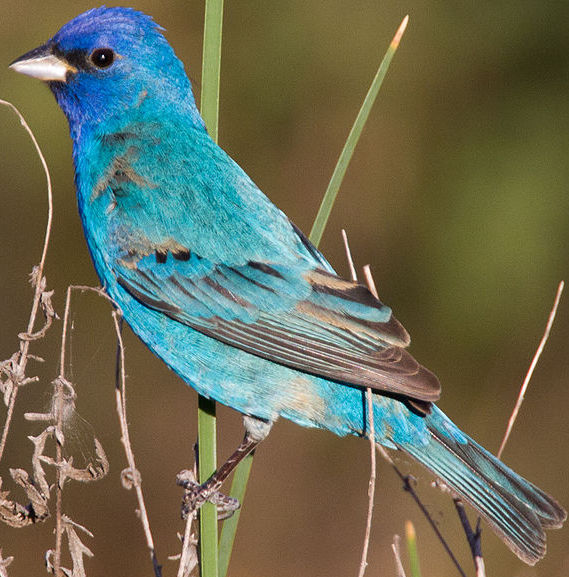
Indigo buntings are songbirds that migrate at night, completing a migratory journey that starts east of the North American continental divide, crosses the Gulf of Mexico, and ends in southern Mexico and Central America. How, while flying at night, do they know where to go?
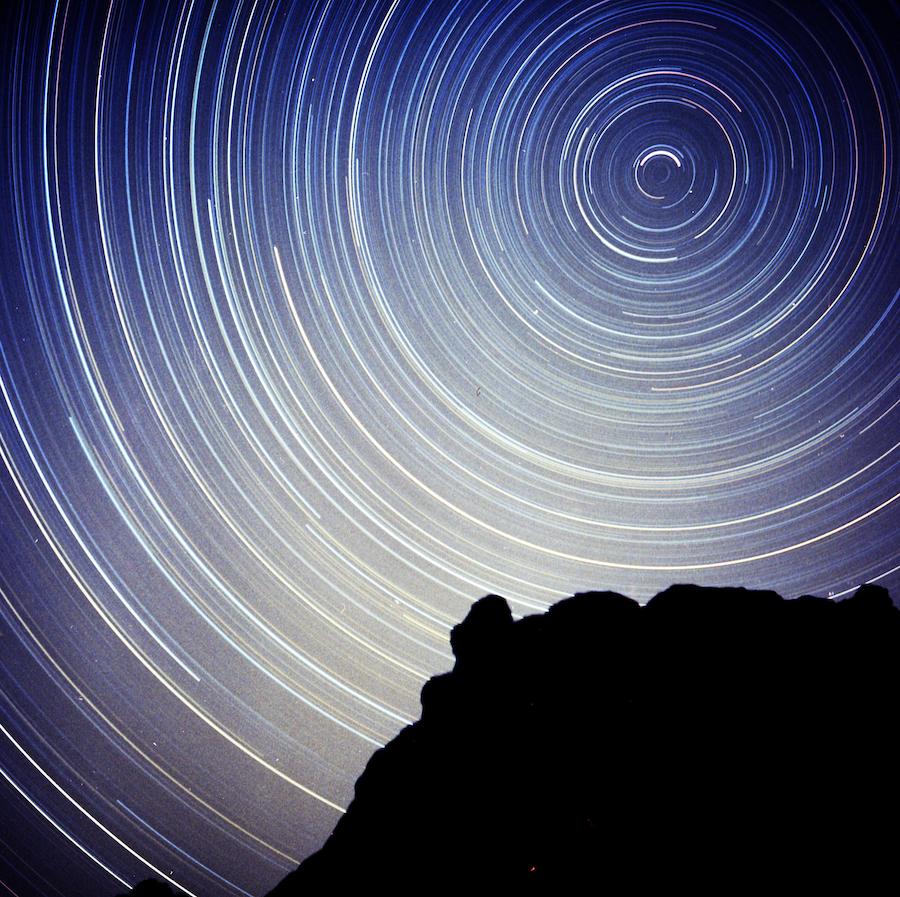
If you were out at night, and you knew where to look, you could navigate by orienting yourself relative to the North Star. The North Star, unlike the other stars in the night sky, is fixed in position. All the other stars rotate around it, as you can see in this time-lapse photo (on your left).
Experiments in the 1950s indicated that buntings did, indeed, use the stars for navigation during their migrations. But not, as was initially believed, through a genetically encoded map of the stars. Rather, as was established by Cornell scientist Stephen Emlen, young buntings learned the position of the North Star and used that position to orient themselves to fly south.
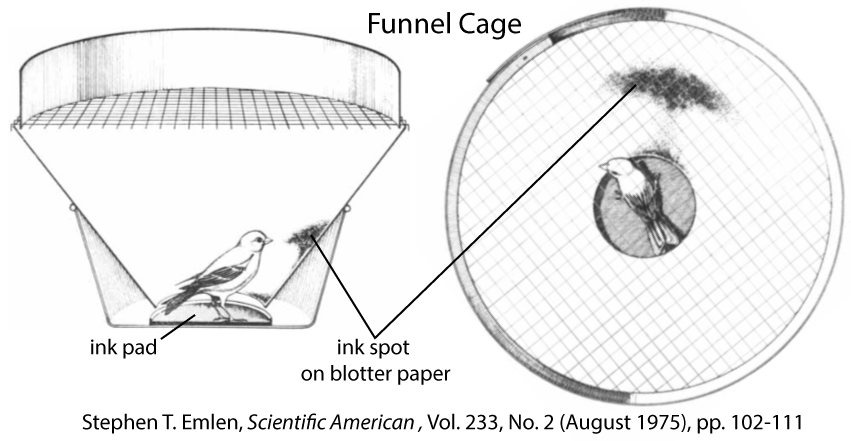
How did Emlen figure this out? (sources: All About Birds (Cornell University) and Scientific American). First, Emlen used a funnel cage (shown below) to determine the bird’s directional preference. The bird could see the sky above through the top of the cage. When it attempted to fly, its feet, stained by ink, would make a mark on blotter paper.
Based on the pattern on the blotter paper, Emlen could create vector diagrams.
To test the hypothesis that buntings learned the position of the North Star, Emlen raised young buntings in a planetarium where he could control the appearance of the night sky. In one of his experiments, he divided the buntings into three groups, as shown below.
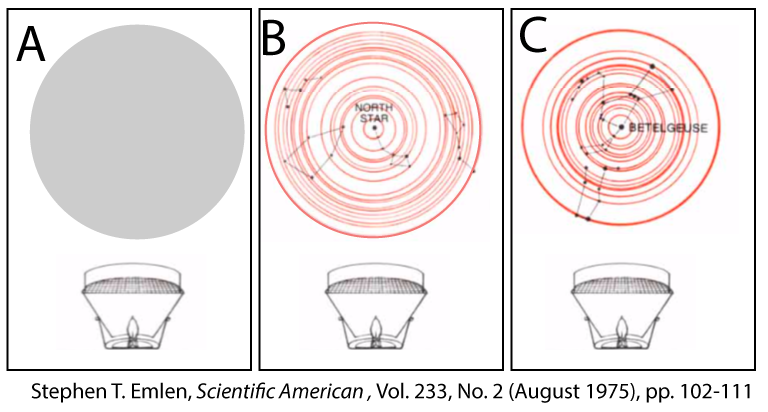
- Group A was raised under a sky with diffuse light.
- Group B was exposed to a planetarium sky that simulated the normal, northern hemispheric night sky, with the stars rotating around the North star.
- Group C was exposed to a planetarium sky in which the stars rotated around a Betelgeuse, a red-giant star in the constellation of Orion.
During the fall migration season (when the buntings migrate south), the birds were tested in funnel cages. Match the vector diagram below with the groups described above.
[qwiz qrecord_id=”sciencemusicvideosMeister1961-Celestial Navigation in Indigo Buntings”]
[h]Orientation by learning star patterns in Indigo Buntings
[q]The three diagrams below are vector graphs made from funnel cages containing Indigo buntings that were exposed to different sky patterns. The diagrams represent each group’s attempt to migrate in a particular direction. Which group of buntings had been raised under a diffusely lit, gray sky?
[c]MQ==[Qq]
[f]Tm8uIEdyb3VwIDEgaXMgb3JpZW50aW5nIGl0c2VsZiBhd2F5IGZyb20gdGhlIHN0YXIgQmV0ZWxnZXVzZS4gVGhhdCB3b3VsZG4mIzgyMTc7dCBwcm92ZSB2ZXJ5IHVzZWZ1bCBpbiB0aGUgd2lsZCwgYnV0IGl0JiM4MjE3O3MgZXZpZGVuY2UgdGhhdCB0aGVzZSBiaXJkcyB3ZXJlIGFibGUgdG8gbGVhcm4gaG93IHRvIG9yaWVudCB0aGVtc2VsdmVzIGJhc2VkIG9uIHdoaWNoIHN0YXIgd2FzIHRoZSBjZW50ZXIgb2Ygcm90YXRpb24gaW4gdGhlIG5pZ2h0IHNreS4=[Qq]
[c]Mg==[Qq]
[f]Tm8uIEdyb3VwIDIgaXMgb3JpZW50aW5nIGl0c2VsZiBhd2F5IGZyb20gdGhlIE5vcnRoIFN0YXIsIGp1c3QgYXMgYmlyZHMgcmFpc2VkIGluIG5hdHVyZSB3b3VsZCBkby4gVGhpcyBpcyB0aGUgcGxhbmV0YXJpdW0tcmFpc2VkIGdyb3VwIHRoYXQgd2FzIGV4cG9zZWQgdG8gYXQgbmlnaHQgc2t5IHdpdGggdGhlIHN0YXJzIHJvdGF0aW5nIGFyb3VuZCB0aGUgTm9ydGggU3Rhci4=[Qq]
[c]Mw ==[Qq]
[f]RXhjZWxsZW50LiBUaGlzIGdyb3VwIHNob3dzIG5vIGFiaWxpdHkgdG8gb3JpZW50IGl0c2VsZi4gVGhhdCYjODIxNztzIGJlY2F1c2UsIGFzIGp1dmVuaWxlcywgdGhleSB3ZXJlIG5ldmVyIGV4cG9zZWQgdG8gYW55IHN0YXIgcGF0dGVybi4=[Qq]
[q]The diagram below shows the migratory inclinations of indigo bunting hatchlings raised in planetariums in which 1) stars rotated around Betelgeuse, 2) stars rotated around the North Star, and 3) no night stars were visible.
Results from which of the groups below are consistent with the (incorrect) idea that buntings were born with a genetically encoded map of the stars.
[c]MQ==[Qq]
[f]Tm8uIElmIGJ1bnRpbmdzIHdlcmUgYm9ybiB3aXRoIGEgZ2VuZXRpY2FsbHkgZW5jb2RlZCBtYXAgb2YgdGhlIHN0YXJzLCB0aGV5IHdvdWxkIGluc3RpbmN0aXZlbHkgZmx5IHNvdXRoLCB3aXRob3V0IG5lZWRpbmcgdG8gbGVhcm4gdGhlIHBvc2l0aW9ucyBvZiB0aGUgc3RhcnMuIEdyb3VwIDEgc2hvd3MgdGhhdCB0aGUgYmlyZHMgcmFpc2VkIHdpdGggYSBuaWdodCBza3kgdGhhdCByb3RhdGVkIGFyb3VuZCBCZXRlbGdldXNlIG9yaWVudGVkIGF3YXkgZnJvbSBCZXRlbGdldXNlIHdoZW4gdGhleSB0cmllZCB0byBpbml0aWF0ZSB0aGVpciBmYWxsIG1pZ3JhdGlvbi4gR3JvdXAgMSwgaW4gb3RoZXIgd29yZHMsIGlzIGNvbnNpc3RlbnQgd2l0aCBsZWFybmluZywgbm90IHdpdGggZ2VuZXRpYyBlbmNvZGluZy4=[Qq]
[c]Mg ==[Qq]
[f]WWVzLiAmIzgyMjA7QmlyZHMgZmx5aW5nIHNvdXRoJiM4MjIxOyBpcyBjb25zaXN0ZW50IHdpdGggdGhlIChpbmNvcnJlY3QpIGdlbmV0aWMgZW5jb2RpbmcgbW9kZWwgb2YgdGhlc2UgYmlyZHMmIzgyMTc7IG1pZ3JhdG9yeSBiZWhhdmlvci4gVGhpbmsgb2YgaXQgdGhpcyB3YXkuIElmIHRoZSBiaXJkcyB3ZXJlIGJvcm4gd2l0aCBhIGdlbmV0aWNhbGx5IGVuY29kZWQgbWFwIG9mIHRoZSBza3ksIHRoZW4gd2hlbiB0aGV5IGhhZCB0aGUgb3Bwb3J0dW5pdHkgdG8gbWlncmF0ZSwgdGhleSB3b3VsZCByZWFkIHRoZSBwb3NpdGlvbnMgb2YgdGhlIHN0YXJzLCBhbmQgaGVhZCBpbiB0aGUgcmlnaHQgZGlyZWN0aW9uLiBUaGVyZSYjODIxNztzIG5vIGNvbnRyYWRpY3Rpb24gYmV0d2VlbiB3aGF0JiM4MjE3O3Mgb2JzZXJ2ZWQgaW4gJiM4MjIwOzImIzgyMjE7IGFuZCB0aGF0IG1vZGVsLiBSYXRoZXIsIGl0JiM4MjE3O3MgbW9kZWxzIDEgYW5kIDMgdGhhdCBydWxlIG91dCB0aGUgZ2VuZXRpY2FsbHkgZW5jb2RlZCBtYXAgaWRlYS4=[Qq]
[c]Mw==[Qq]
[f]Tm8uIElmIGJ1bnRpbmdzIHdlcmUgYm9ybiB3aXRoIGEgZ2VuZXRpY2FsbHkgZW5jb2RlZCBtYXAgb2YgdGhlIHN0YXJzLCB0aGV5IHdvdWxkIGluc3RpbmN0aXZlbHkgZmx5IHNvdXRoLCB3aXRob3V0IG5lZWRpbmcgdG8gbGVhcm4gdGhlIHBvc2l0aW9ucyBvZiB0aGUgc3RhcnMuIEdyb3VwIDMgc2hvd3MgdGhhdCB0aGUgYmlyZHMgcmFpc2VkIGluIGEgc2ltdWxhdGVkIG5pZ2h0IHNreSB3aXRob3V0IHN0YXJzIHdlcmUgdW5hYmxlIHRvIGZpZ3VyZSBvdXQgd2hpY2ggZGlyZWN0aW9uIHRoZXkgc2hvdWxkIG1pZ3JhdGUuIEluIG90aGVyIHdvcmRzLCB0aGV5IG5lZWQgdG8gbGVhcm4gdGhlIHBvc2l0aW9ucyBvZiB0aGUgc3RhcnM6IGl0JiM4MjE3O3Mgbm90IHdyaXR0ZW4gaW50byB0aGVpciBETkEu[Qq]
[/qwiz]
4. Loggerhead Sea Turtle Migrations
Loggerhead sea turtles (Caretta caretta) have shells that are about 90 cm long. Adults can weigh 135 kg (298 lbs), with the largest specimens weighing up to 450 kg (1000 lbs). These animals have a lifespan between 47 and 67 years of age and reach sexual maturity when they’re about 17 years old. They are omnivorous, eating bottom-dwelling invertebrates when living close to shore, and consuming jellyfish, floating mollusks, floating egg clusters, and any fish they can catch while out in the open sea (source: Wikipedia).
Loggerhead turtles that live in the Atlantic ocean migrate from the Atlantic coast of North and South America to the Western Coast of Africa, and then return, often many years later. Their return (as we’ll see below) is often to the beach where they were born.
Loggerheads face three navigational challenges during their lives:
- FINDING THE OCEAN (SEAFINDING): Female loggerheads lay their eggs on sandy beaches. To do this, the females need to exit the water, drag themselves above the high tide line (so that the eggs don’t drown), and then use their hind flippers to excavate a pit into which they lay a clutch of over 100 eggs. Eighty days later, the eggs hatch. The hatchlings, which are only about 4.6 cm long and weigh about 20 grams, have to dig up through the sand to get to the surface. Once they’re at the surface, they’re in danger from predation and quickly have to find their way to the ocean.
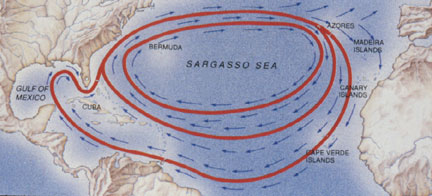
- FINDING THEIR WAY TO THE SARGASSO SEA: Once they’re in the open sea, Atlantic turtles use a combination of swimming and floating to find their way to the warm waters of the Sargasso sea (in the middle of the Atlantic ocean). Once there, the turtles forage for years as they grow to adult size and reproductive maturity.
- FINDING THEIR WAY BACK TO THE BEACH WHERE THEY WERE BORN. Recent genetic studies indicate that female turtles return to the beaches where they were born to lay their eggs.
Let’s look at each of these challenges, focusing on how biologists have identified what stimuli are driving sea turtle behavior, and how the turtles respond.
4a. Seafinding

Hatchlings emerge from their nests onto the sand, usually during the night. There are a variety of stimuli that they can use to find their way to the ocean. The visual stimuli include the elevated landward horizon, usually darkened by vegetation, and the lower and usually brighter view toward the sea. At the same time, the beach slopes down toward the ocean.
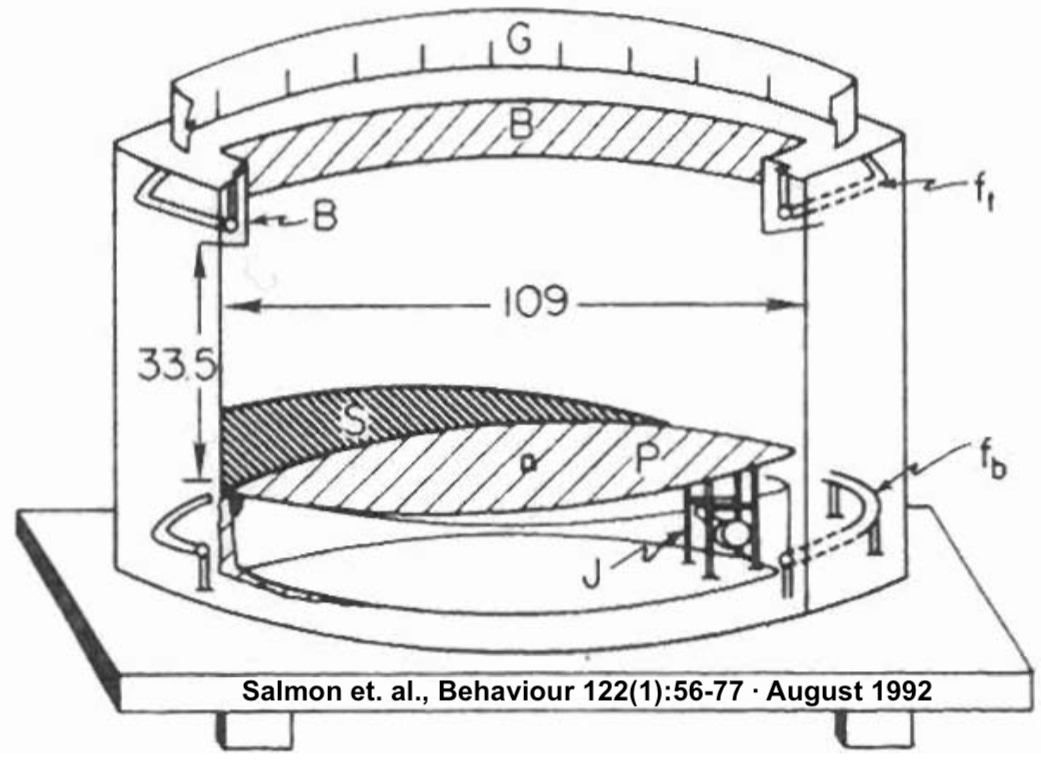
When scientists observe turtle hatchlings in the wild, all of these variables are at play at once. To tease them apart, a team led by Michael Salmon constructed a circular arena (shown at left) where they were able to control variables such as the amount and direction of light, the slope, and the position of the silhouettes (the dark outlines of the vegetation-covered landward slope).
Here’s how the testing arena worked: ft and fb are fluorescent light tubes; P is the platform, the angle of which could be adjusted by the jack (J). S is a screen that could be used to create silhouettes.
The hatchling would be “gently placed on the center of the platform, and then released.” A short tether was attached to the turtle’s carapace (shell). Once released, the turtles would crawl until they reached the end of the tether, after which they would continue to crawl in place. Their chosen direction was measured after one minute.
The circles shown in the quiz below represent a top-down view of the arena. Each of the four setups is simulating, to varying degrees, the visual experience of hatchling turtles in nature, in which the seaward side is more brightly lit than the landward side. In all four experiments, there was illumination from the front (which represents the sea), but illumination behind varied (as indicated in the image and described in the text below each circle.
[qwiz qrecord_id=”sciencemusicvideosMeister1961-Seafinding in Sea Turtles”]
[h]Seafinding in Hatchling Sea Turtles
[q labels = “top”]If walking randomly would be a weak response, and walking straight in one direction be a strong response, predict how each of the four setups below would generate a response from the turtles. Guessing is fine!
[l]Strongest
[fx] No. Please try again.
[f*] Correct!
[l]2nd Strongest
[fx] No, that’s not correct. Please try again.
[f*] Great!
[l]3rd Strongest
[fx] No, that’s not correct. Please try again.
[f*] Good!
[l]Weakest
[fx] No, that’s not correct. Please try again.
[f*] Correct!
[q]Here you can see each setup paired with its results. Each of the lines in the lower circles represents both the direction and distance moved by one turtle. The small triangle on the top of the first three lower circles represents the average angle the turtles walked. The higher the “r” value, the more clustered together the test subjects’ responses were.
Which of the following is the best explanation of the results?
[c]QmVjYXVzZSBzZWFmaW5kaW5nIGlzIGlubmF0ZSwgaGF0Y2hsaW5nIHR1cnRsZXMgY2FuIGZpbmQgdGhlaXIgd2F5IHRvd2FyZCB0aGUgb2NlYW4sIGV2ZW4gaW4gdGhlIGFic2VuY2Ugb2YgYXBwcm9wcmlhdGUgc3RpbXVsaS4=[Qq]
[f]Tm8uIE5vdGUgdGhhdCB0aGUgc3RpbXVsaSBhcmUgcXVpdGUgZGlmZmVyZW50IGluIGVhY2ggc2V0dXAsIGFzIGFyZSB0aGUgcmVzcG9uc2VzLiBUaGUgaGF0Y2hsaW5ncyBpbiBncm91cCAmIzgyMjA7QSYjODIyMTsgc2VlbWVkIHRvIGhhdmUgdGhlIHN0cm9uZ2VzdCByZXNwb25zZS4gSG93IGRvZXMgdGhhdCByZWxhdGUgdG8gdGhlIHN0aW11bHVzIHRoZXkgd2VyZSBleHBvc2VkIHRvPw==[Qq]
[c]QSBkaWZmdXNlIGxpZ2h0IHNvdXJjZSwgdGhlIGtpbmQgdGhhdCB3b3VsZCBiZSBleHBlcmllbmNlZCBvbiBhIGJyaWdodCwgbW9vbmxpdCBuaWdodCwgZ2VuZXJhdGVkIHRoZSBzdHJvbmdlc3QgcmVzcG9uc2Uu[Qq]
[f]Tm8uIERpZmZ1c2UgbGlnaHQgaXMgd2hhdCB3YXMgZXhwZXJpZW5jZWQgYnkgdGhlIGhhdGNobGluZ3MgaW4gZ3JvdXAgRC4gTm90ZSB0aGF0IHRoZWlyIHJlc3BvbnNlIGlzIGFsbW9zdCByYW5kb20sIHdpdGggdGhlIGhhdGNobGluZ3Mgd2Fsa2luZyBpbiBhbGwgZGlyZWN0aW9ucy4=[Qq]
[c]U3Ryb25nIGNvbnRyYXN0IGJldHdlZW4gb25lIHNpZGUgYW5kIHRoZSBvdGhlciBzaWRlIG9mIHRoZS BhcmVuYSBlbGljaXRlZCB0aGUgc3Ryb25nZXN0IHJlc3BvbnNlIGZyb20gdGhlIGhhdGNobGluZ3Mu[Qq]
[f]RXhjZWxsZW50LiBUaGF0JiM4MjE3O3Mgd2h5ICYjODIyMDtBJiM4MjIxOyBoYXMgdGhlIHN0cm9uZ2VzdCByZXNwb25zZS4=[Qq]
[q]Based on the results of this experiment, the greatest disruption to the hatchling’s ability to find their way toward the sea would be
[c]QWlyIHBvbGx1dGlvbiB0aGF0IG9ic2N1cmVkIHRoZSBtb29uIGFuZCBzdGFycw==[Qq]
[f]Tm8uIFdoaWxlIGFpciBwb2xsdXRpb24gd291bGQgcHJvYmFibHkgYmUgYmFkIGZvciB0aGUgaGF0Y2hsaW5nJiM4MjE3O3Mgb3ZlcmFsbCBoZWFsdGgsIGl0IG1pZ2h0IG5vdCBoYXZlIG11Y2ggZWZmZWN0IG9uIHRoZWlyIHNlYSBmaW5kaW5nLiBUaGUgb2NlYW4gd2F0ZXIgd291bGQgc3RpbGwgYmUgYnJpZ2h0ZXIgdGhhbiB0aGUgdmVnZXRhdGlvbi1jb3ZlcmVkIGxhbmRzY2FwZSBhYm92ZSB0aGUgYmVhY2guIFRoZSBoYXRjaGxpbmdzIGNvdWxkIHByb2JhYmx5IHN0aWxsIGJlIGFibGUgdG8gb3JpZW50IGNvcnJlY3RseSwgYXMgaW4gJiM4MjIwO0EmIzgyMjE7IGJlbG93Lg==[Qq]
[c]TGFyZ2UgY3J1aXNlIHNoaXBzIHRoYXQgYW5jaG9yIGVhY2ggbmlnaHQgaW1tZWRpYXRlbHkgb2Zmc2hvcmUsIGNhc3RpbmcgbGlnaHQgb250byB0aGUgYmVhY2gu[Qq]
[f]Tm8uIFRoZSBjcnVpc2Ugc2hpcHMgd291bGQgZW5oYW5jZSB0aGUgc3RpbXVsaSB0aGF0IGRyaXZlIHRoZSBoYXRjaGxpbmdzIHRvd2FyZCB0aGUgc2VhLiBUaGUgb2NlYW4gd2F0ZXIgd291bGQgc3RpbGwgYmUgYnJpZ2h0ZXIgdGhhbiB0aGUgdmVnZXRhdGlvbi1jb3ZlcmVkIGxhbmRzY2FwZSBhYm92ZSB0aGUgYmVhY2guIFRoZSBoYXRjaGxpbmdzIGNvdWxkIHByb2JhYmx5IHN0aWxsIGJlIGFibGUgdG8gb3JpZW50IGNvcnJlY3RseSwgYXMgaW4gJiM4MjIwO0EmIzgyMjE7IGJlbG93Lg==
Cg==[Qq]
[c]SG90ZWwgZGV2ZWxvcG1lbnQgaW4gdGhlIGFyZWFzIGFib3ZlIHRo ZSBiZWFjaGVzIHdoZXJlIHRoZSBoYXRjaGxpbmdzIGVtZXJnZS4=[Qq]
[f]TmljZSBqb2IuIFdoYXQgc2VlbXMgdG8gZHJpdmUgdGhlIGhhdGNobGluZyYjODIxNztzIGJlaGF2aW9yIGlzIHRoZSBjb21iaW5hdGlvbiBvZiBhIGJyaWdodGVyIHNlYXdhcmQgc2lkZSBhbmQgYSBkYXJrZXIgbGFuZHdhcmQgc2lkZSwgYXMgaW4gJiM4MjIwO0EmIzgyMjE7IGJlbG93LiBIb3RlbHMgd2l0aCBicmlnaHQgbGlnaHRzIG9uIHRoZSBsYW5kd2FyZCBzaWRlIGNvdWxkIHByZXNlbnQgdGhlIGhhdGNobGluZ3Mgd2l0aCBjb25mdXNpbmcgc3RpbXVsaSwgYW5kIGNhdXNlIHRoZW0gdG8gd2FsayBhd2F5IGZyb20gdGhlIHNlYS4=
Cg==[Qq]
[/qwiz]
Further experiments by Salmon et al. looked at the effects of silhouettes and slopes on the hatchlings’ ability to find the ocean. For your purposes as a student in an AP or introductory college course, the key thing to note is how the researchers were able to isolate the variables that most strongly drive these animals’ behavior. I recommend that you read their article (available here for free download at ResearchGate.net).
4b. Using magnetoreception to orient while out at sea
Once they’re away from the shore, how does a sea turtle know where to go? Sea turtles born on the Atlantic coast of North, Central, or South America need to head east to reach the Sargasso sea (see map above) where they’ll mature. Then, decades later, they need to be able to swim west back to the beaches where they hatched. How do they know which way is east or west?
While humans lack this ability, organisms as diverse as bacteria, salmon, bees, ants, termites, frogs, and birds can sense and orient themselves using the Earth’s magnetic field. This ability is called magnetoreception. To test whether sea turtles used magnetoreception, Kenneth and Catherine Lohmann created this device:
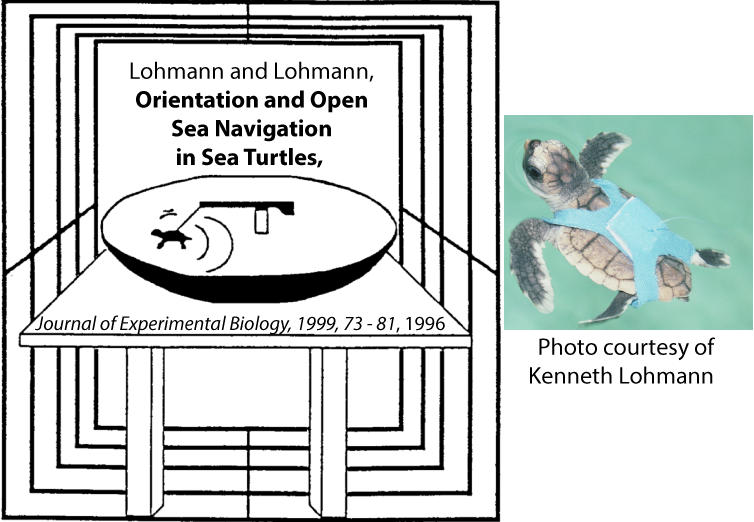
Here’s how it worked. A sea turtle hatchling was tethered to a rotatable lever-arm, in a basin filled with seawater. The hatchling could swim in any desired direction (and it would continue swimming in place once it reached the end of its tether). The parallel lines surrounding the basin represent a Rubens coil system that could reverse the Earth’s magnetic field within the test chamber.
A turtle’s ability to orient itself using magnetic fields requires some learning that looks a lot like the imprinting discussed in the previous tutorial. Based on the turtles’ natural history, it was thought that turtles combine their experience of light coming from a particular direction with their perception of the direction of a magnetic field. For example, a turtle that hatches in the Americas will be following the light of the sea, and swimming away from the darker land behind. If they were heading directly east, then north would be to their left. Once that perception was imprinted into the turtle’s nervous system, it would no longer need light to orient itself and could orient itself by its internal magnetic compass.
To test this in an experimental setting, sea turtle hatchlings were permitted to establish a course swimming toward a dim light in the east. The result? This imprinted their internal compass. We know that because, after that initial exposure to light and a magnetic field, the hatchlings could orient toward the east even in total darkness. Moreover, when the Rubens coil system was used to flip the orientation of the magnetic field that the turtles were experiencing, they changed direction.
To make sure you’re getting it, answer the following questions.
[qwiz qrecord_id=”sciencemusicvideosMeister1961-Magnetoreception in Sea Turtles”]
[h]Magnetoreception in turtles
[i]
[q]In the diagram below, each dot represents the angle of orientation of a single hatchling. The arrow represents the mean angle of the group. The dotted lines represent 95% confidence intervals.
Immediately upon hatching, a group of hatchlings experienced a dim light to the east. They were then released to swim in total darkness. Which circle represents the direction the hatchlings swam in?
[textentry single_char=”true”]
[c]QQ ==[Qq]
[f]WWVzLiDigJxB4oCdIHNob3dzIHRoYXQgZXZlbiBpbiB0b3RhbCBkYXJrbmVzcywgdGhlIG1ham9yaXR5IG9mIHRoZSB0dXJ0bGVzIHN3YW0gdG93YXJkIHRoZSBlYXN0LiBUaGF0JiM4MjE3O3MgYmVjYXVzZSB0aGVpciBpbnRlcm5hbCBjb21wYXNzIGhhZCBiZWVuIGNvcnJlY3RseSBpbXByaW50ZWQsIGFuZCB0aGV5IHdlcmUgYWJsZSB0byBvcmllbnQgdGhlbXNlbHZlcyB0byBzd2ltIGluIHRoZWlyIHByZWZlcnJlZCBkaXJlY3Rpb24gKGVhc3QpLCBldmVuIGluIHRvdGFsIGRhcmtuZXNzLg==[Qq]
[c]Kg==[Qq]
[f]Tm8uIEhlcmUmIzgyMTc7cyBhIGhpbnQuIFRoZSBoYXRjaGxpbmcmIzgyMTc7cyBleHBvc3VyZSB0byBsaWdodCBpbXByaW50ZWQgdGhlaXIgYnJhaW5zJiM4MjE3OyBpbnRlcm5hbCBtYWduZXRpYyBjb21wYXNzLiBBcyBhIHJlc3VsdCwgZXZlbiBpbiBkYXJrbmVzcywgdGhleSBjb3VsZCBzd2ltIGluIHRoZWlyIHByZWZlcnJlZCBkaXJlY3Rpb24uIFdoaWNoIG9mIHRoZSBncmFwaHMgYWJvdmUgc2hvd3MgdGhlIHR1cnRsZXMgc3dpbW1pbmcgdG93YXJkIHRoZSBlYXN0Pw==[Qq]
[q]In the diagram below, each dot represents the angle of orientation of a single hatchling. The arrow represents the mean angle of the group. The dotted lines represent 95% confidence intervals.
Immediately upon hatching, a group of hatchlings experienced a dim light to the east. They were then released to swim in total darkness, in the apparatus described above. If the apparatus reversed the magnetic field experienced by the swimming hatchlings, in which direction would they head? Choose a graph that represents the correct direction.
[textentry single_char=”true”]
[c]Qg ==[Qq]
[f]WWVzLiDigJxC4oCdIHNob3dzIHRoYXQgZXZlbiBpbiB0b3RhbCBkYXJrbmVzcywgdGhlIHR1cnRsZXMgY291bGQgdXNlIGEgbWFnbmV0aWMgZmllbGQgdG8gb3JpZW50IHRoZW1zZWx2ZXMgYW5kIHN3aW0gaW4gdGhlIGRlc2lyZWQgZGlyZWN0aW9uLiBUaGVpciBkZXNpcmVkIGRpcmVjdGlvbiBpcyBlYXN0LiBIb3dldmVyLCB0aGUgbWFnbmV0aWMgZmllbGQgd2FzIGZsaXBwZWQuIEFzIGEgcmVzdWx0LCBpbiB0b3RhbCBkYXJrbmVzcywgdGhlIHR1cnRsZXMgd2lsbCBzd2ltIGluIHRoZSBvcHBvc2l0ZSBkaXJlY3Rpb24sIG9yIHRvd2FyZCB0aGUgd2VzdC4=[Qq]
[c]Kg==[Qq]
[f]Tm8uIEhlcmUmIzgyMTc7cyBhIGhpbnQuIFRoZSBoYXRjaGxpbmcmIzgyMTc7cyBleHBvc3VyZSB0byBsaWdodCBpbXByaW50ZWQgdGhlaXIgYnJhaW5zJiM4MjE3OyBpbnRlcm5hbCBtYWduZXRpYyBjb21wYXNzLiBBcyBhIHJlc3VsdCwgZXZlbiBpbiBkYXJrbmVzcywgdGhleSBjb3VsZCBzd2ltIGluIHRoZWlyIHByZWZlcnJlZCBkaXJlY3Rpb24uIFRoZWlyIHByZWZlcnJlZCBkaXJlY3Rpb24sIGJlY2F1c2Ugb2YgdGhlaXIgaW1wcmludGluZywgaXMgdG93YXJkIHRoZSBlYXN0LiBJZiB0aGUgbWFnbmV0aWMgZmllbGQgaXMgcmV2ZXJzZWQsIHdoYXQgZGlyZWN0aW9uIHdpbGwgdGhleSBzd2ltIGluPw==[Qq]
[q]In the diagram below, each dot represents the angle of orientation of a single hatchling. The arrow represents the mean angle of the group. The dotted lines represent 95% confidence intervals.
A group of hatchlings was kept in total darkness. They were then released into the testing chamber, enabling scientists to test the direction in which they chose to swim. Which of the diagrams below represents these turtles?
[textentry single_char=”true”]
[c]Qw ==[Qq]
[f]WWVzLiDigJxD4oCdIHNob3dzIHRoYXQgd2l0aG91dCBleHBvc3VyZSB0byBsaWdodCwgdGhlIHR1cnRsZSYjODIxNztzIGludGVybmFsIGNvbXBhc3Mgd29uJiM4MjE3O3QgYmUgc2V0LiBBcyBhIHJlc3VsdCwgdGhlIGRpcmVjdGlvbiBpbiB3aGljaCB0aGV5IHN3aW0gaXMgcmFuZG9tLg==[Qq]
[c]Kg==[Qq]
[f]Tm8uIEhlcmUmIzgyMTc7cyBhIGhpbnQuIHdpdGhvdXQgZXhwb3N1cmUgdG8gbGlnaHQsIHRoZSB0dXJ0bGUmIzgyMTc7cyBpbnRlcm5hbCBjb21wYXNzIHdvbiYjODIxNzt0IGJlIHNldC4gSWYgdGhlIHR1cnRsZXMgZG9uJiM4MjE3O3QgaGF2ZSBhIGNvbXBhc3MsIHRoZXkgd29uJiM4MjE3O3QgYmUgYWJsZSB0byBvcmllbnQuIFdoaWNoIGNpcmNsZSByZXByZXNlbnRzIHRoZSBtb3ZlbWVudCBvZiBhIGdyb3VwIG9mIHR1cnRsZXMgdGhhdCBjYW4mIzgyMTc7dCBvcmllbnQgaW4gYSBzcGVjaWZpYyBkaXJlY3Rpb24/[Qq]
[q]Let’s pull this all together. The Lohmanns’ experiment established that hatchling sea turtles are capable of sensing [hangman] fields, a sense that’s known as [hangman]. However, for their internal compass to be correctly set, the turtles need to be exposed to [hangman], which results in a kind of one-trial learning that’s known as [hangman].
[c]bWFnbmV0aWM=[Qq]
[c]bWFnbmV0b3JlY2VwdGlvbg==[Qq]
[c]bGlnaHQ=[Qq]
[c]aW1wcmludGluZw==[Qq]
[x][restart]
[/qwiz]
4c. Using Geomagnetic Signatures to Find their Way Home
The hatchlings’ ability to detect magnetic fields helps them to find the Gulf stream, which brings the turtles to the Sargasso Sea, where they grow to adulthood. After decades at sea, adult sea turtles can find their way back to their natal beaches (the beaches where they were born). That raises two questions. First, how do we know that the turtles do return to the beaches where they were born? Secondly, what’s the mechanism by which they find their way back to their natal beaches, after decades out at sea?
The evidence for turtles’ returning to their natal beaches isn’t from capture, mark, release, and recapture studies. That’s because the turtles start life as very small animals, with high mortality rates, and they don’t return to their nesting beaches for decades. Any marked hatchling would have to remain marked for years, and any one individual has a low chance of returning (because it’s more likely to be part of the 99% or more of hatchlings that don’t survive to adulthood). In addition, any researcher who bothered to mark hatchlings for subsequent recapture as an adult would have to wait decades to get any data — not a recipe for success in academia.
Rather, the evidence for natal homing is genetic and comes through analysis of mitochondrial DNA (mtDNA), which is only passed down through the maternal line ( the males, once they make it to sea, never come ashore). A study by Meylan, Bowen, and Avise (source: Science. 1990 May 11;248(4956):724-7) of mtDNA in green turtle colonies (which are a distinct species from the loggerheads we’ve looked at so far) shows that the nesting colonies consist of genetically similar individuals. That’s what you’d expect to see if most of the females nesting on any beach are sisters or cousins (with the same mitochondrial DNA). If that’s not clear, just imagine the alternative: if females didn’t return to their natal beaches, then any colony would be full of non-related individuals, and there’d be a high degree of genetic difference observable on any beach.
So, what are turtles sensing that brings them home?
 In a 2018 study by Brothers and Lohmann, mitochondrial DNA was obtained from 834 nesting sea turtles at 20 different locations. Using the mitochondrial DNA, the researchers were able to calculate how much the populations in different colonies were related to one another.
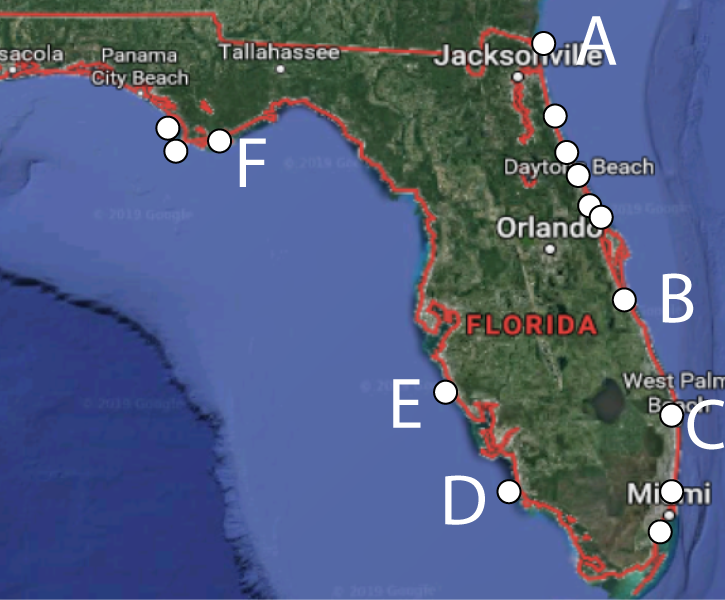
Before looking at their results, let’s think about the relatedness between nesting populations. Here’s a map of Florida. The white circles indicate nesting sites, with six sites lettered.
[qwiz]
[h]Finding Natal beaches, 1
[q multiple_choice=”true”] Think about what you know about biogeography, population genetics, and evolution. Which of the populations below would be most closely related to population “B?”
[c]QcKgIA==[Qq][c]Q8KgIA==[Qq][c]RMKgIA==[Qq][c]IEXC oCA=[Qq][c]Rg==
[f]IE5vLiBUaGUgYW5zd2VyIGlzIHBvcHVsYXRpb24gJiM4MjIwO0UuJiM4MjIxOyBBbmQgdGhhdCYjODIxNztzIGJlY2F1c2Ugb2YgdGhlIHdheSB0aGF0IHR1cnRsZXMgdXNlIHRoZSBFYXJ0aCYjODIxNztzIG1hZ25ldGljIGZpZWxkIHRvIG5hdmlnYXRlLiBSZWFkIG9uIHRvIHNlZSBob3cgdGhpcyB3b3Jrcy4=[Qq]
[f]IE5vLiBXaGlsZSAmIzgyMjA7QyYjODIyMTsgaXMgdGhlIGNsb3Nlc3QsIHRoZSBhbnN3ZXIgaXMgcG9wdWxhdGlvbiAmIzgyMjA7RS4mIzgyMjE7IEFuZCB0aGF0JiM4MjE3O3MgYmVjYXVzZSBvZiB0aGUgd2F5IHRoYXQgdHVydGxlcyB1c2UgdGhlIEVhcnRoJiM4MjE3O3MgbWFnbmV0aWMgZmllbGQgdG8gbmF2aWdhdGUuIFJlYWQgb24gdG8gc2VlIGhvdyB0aGlzIHdvcmtzLg==[Qq]
[f]IE5vLiBUaGUgYW5zd2VyIGlzIHBvcHVsYXRpb24gJiM4MjIwO0UuJiM4MjIxOyBBbmQgdGhhdCYjODIxNztzIGJlY2F1c2Ugb2YgdGhlIHdheSB0aGF0IHR1cnRsZXMgdXNlIHRoZSBFYXJ0aCYjODIxNztzIG1hZ25ldGljIGZpZWxkIHRvIG5hdmlnYXRlLiBSZWFkIG9uIHRvIHNlZSBob3cgdGhpcyB3b3Jrcy4=[Qq]
[f]IEV4Y2VsbGVudC4gSW4gdGhlIHR1cnRsZSYjODIxNztzIHBlcmNlcHR1YWwgd29ybGQsIHRoZSBiZWFjaCBhdCBFIGlzIHRoZSBvbmUgbW9zdCBzaW1pbGFyIHRvIHRoZSBiZWFjaCBhdCAmIzgyMjA7Qi4mIzgyMjE7IFJlYWQgb24gdG8gc2VlIGhvdyB0aGlzIHdvcmtzLg==[Qq]
[f]IE5vLiBUaGUgYW5zd2VyIGlzIHBvcHVsYXRpb24gJiM4MjIwO0UuJiM4MjIxOyBBbmQgdGhhdCYjODIxNztzIGJlY2F1c2Ugb2YgdGhlIHdheSB0aGF0IHR1cnRsZXMgdXNlIHRoZSBFYXJ0aCYjODIxNztzIG1hZ25ldGljIGZpZWxkIHRvIG5hdmlnYXRlLiBSZWFkIG9uIHRvIHNlZSBob3cgdGhpcyB3b3Jrcy4=[Qq]
[x][restart]
[/qwiz]
The degree of genetic differentiation between these different populations can be quantified as what’s called an FST value. Populations that have a lot of genetic differences (many differences in allele frequencies) between them have an FST of 1.0. Populations that are identical to one another would have an FST of 0.0.
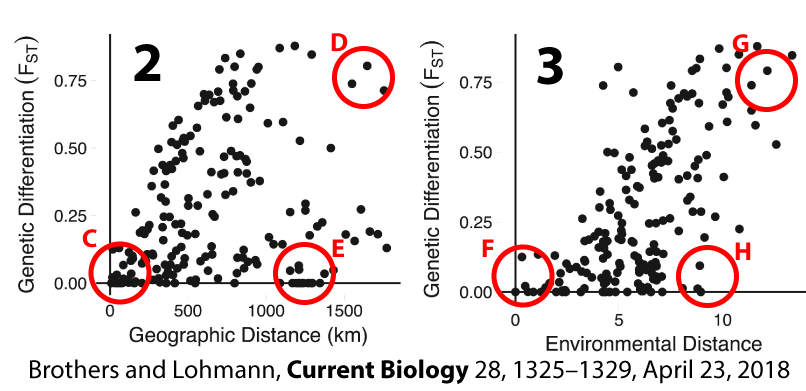
The graphs above show genetic differentiation (on the Y-axis) as a function of geographic distance (Graph 2) and environmental distance (graph 3). Geographic distance is what it sounds like: how far away one population lives from one another. While there are many cases where populations that live close to one another are closely related (see “C”), there are other cases (see “E”) where distant populations are closely related to one another. Why would that be?
Graph 3 looks at genetic distance as a function of environmental distance. Environmental distance is a measure, based on a checklist of variables, of how similar two environments are to one another. Again, there are some cases where there is a close correlation between environmental distance and genetic distance (note the populations at “F” and “G”), but there are also cases where there’s a lot of environmental distance, but a close genetic relationship (see “H”).
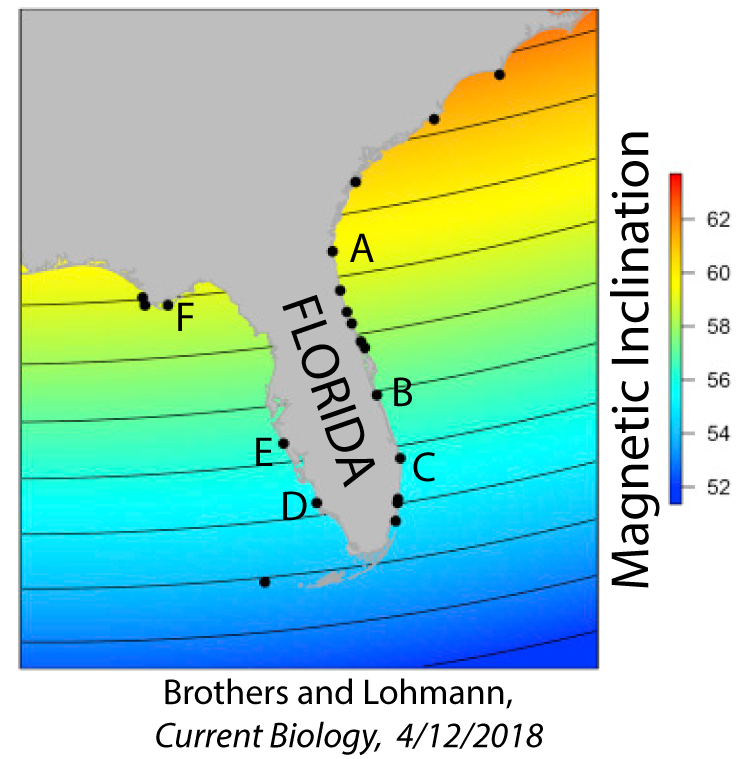 It was already established that hatchling turtles navigate out to sea using magnetoreception. Could it be possible that these turtles, as adults, were finding their way back to the beaches where they were born through the same sense? Here’s a map of Florida showing its geomagnetic profile. The earth’s magnetic field, at any particular location on our planet, has a quantifiable intensity and inclination. The field’s intensity is simply how strong the field is; the inclination is the angle made with the horizontal by the magnetic field lines.
See if you can predict where this is going by completing the questions below.
[qwiz qrecord_id=”sciencemusicvideosMeister1961-Finding Natal Beaches”]
[h]Finding Natal beaches, 2
[q] In graph 1 below, Brothers and Lohmann plotted [hangman] differentiation (on the Y-axis) against [hangman]distance (on the X-axis). Note the correlation: if populations (like those in “A”) are located in areas that have a(n) [hangman] amount of magnetic distance, then these populations will also have a small amount of genetic differentiation.
[c]IGdlbmV0aWM=[Qq]
[c]IG1hZ25ldGlj[Qq]
[c]IHNtYWxs[Qq]
[q] For example, in the map below, which beach is geomagnetically most similar to the beach at “A?”
[textentry single_char=”true”]
[c]IE Y=[Qq]
[f]IEV4Y2VsbGVudC4gVGhlIGJlYWNoZXMgYXQgQSBhbmQgRiBhcmUsIGluIHRlcm1zIG9mIG1hZ25ldGljIGluY2xpbmF0aW9uLCB0aGUgbW9zdCBzaW1pbGFyLg==[Qq]
[c]IEVudGVyIHdvcmQ=[Qq]
[c]ICo=[Qq]
[f]Tm8uIFlvdSBjYW4gdXNlIHRoZSBjb2xvciBjb2RpbmcgaW4gdGhlIGRpYWdyYW0sIHdoaWNoIGluZGljYXRlcyB0aGUgbWFnbmV0aWMgaW5jbGluYXRpb24uIFdoaWNoIGxldHRlciBoYXMgYSBjb2xvciB0aGF0JiM4MjE3O3MgY2xvc2VzdCB0byB0aGUgY29sb3Igb24gdGhlIG1hcCBmb3IgdGhlIGJlYWNoIGF0ICYjODIyMDtBPyYjODIyMTs=[Qq]
[/qwiz]
For a 2018 summary of how sea turtles return to their natal beaches, read this article in the NY Times.
5. Migration: Checking Understanding
In our study of migration, we’ve covered a lot of distance. Let’s consolidate our learning through the quiz below.
[qwiz qrecord_id=”sciencemusicvideosMeister1961-Animal Migration, CFU”]
[h]Animal Migration: Checking Understanding
[i] Biohaiku
Animals Migrate
To find food or breeding grounds
When will we arrive?
[q] A [hangman] is when a population of animals interrupts its daily movement pattern to travel in a persistent direction to a new habitat.
[c]IG1pZ3JhdGlvbg==[Qq]
[f]IENvcnJlY3Qh[Qq]
[q] The Earth’s champion migrator might be the Arctic[hangman], which travels from its breeding grounds above Greenland in the [hangman], and then migrates south to [hangman]
[c]IHRlcm4=[Qq]
[f]IEdvb2Qh[Qq]
[c]IEFyY3RpYw==[Qq]
[f]IEV4Y2VsbGVudCE=[Qq]
[c]IEFudGFyY3RpY2E=[Qq]
[f]IEV4Y2VsbGVudCE=[Qq]
[q] Because Indigo buntings migrate a [hangman], they need to use the [hangman] star to figure out their southward direction. They do this by [hangman] which star is the center of [hangman] in the night sky.
[c]IG5pZ2h0[Qq]
[f]IEdyZWF0IQ==[Qq]
[c]IE5vcnRo[Qq]
[f]IEdvb2Qh[Qq]
[c]IGxlYXJuaW5n[Qq]
[f]IEdyZWF0IQ==[Qq]
[c]IHJvdGF0aW9u[Qq]
[f]IEV4Y2VsbGVudCE=[Qq]
[q] When loggerhead sea turtle hatchlings emerge from their sandy nests, here’s how they find the sea: they’re drawn [hangman] the more brightly lit ocean, and [hangman] from the darker, vegetated areas behind them.
[c]IHRvd2FyZA==[Qq]
[c]IGF3YXk=[Qq]
[q] In the absence of light or other sensory cues, organisms as diverse as bacteria, salmon, bees, ants, termites, frogs, and birds can sense and orient themselves using the Earth’s [hangman] field.
[c]IG1hZ25ldGlj[Qq]
[q] The ability of certain animals to sense the earth’s magnetic field is called [hangman].
[c]IG1hZ25ldG9yZWNlcHRpb24=[Qq]
[q] We know that female sea turtles return to the beaches where they were born through analysis of the [hangman] DNA possessed by the females in any nesting area.
[c]IG1pdG9jaG9uZHJpYWw=[Qq]
[q]Based on similarities in mitochondrial DNA between different nesting beaches, it appears that sea turtles can return to their natal beaches based on that beach’s [hangman] profile
[c]Z2VvbWFnbmV0aWM=[Qq]
[/qwiz]
Links
- Living in Groups (the next tutorial in this module)
- Animal Behavior Menu