1. Overharvest/Hunting to Extinction
As omnivores, humans have always harvested animals for food (or other animal parts, such as skins, bones, guts, or horns). In terms of biodiversity, this is only a problem when harvest becomes overharvest. As discussed above, humans have an ancient legacy of hunting their prey to extinction. This goes back at least as far as the extinction of animals like woolly mammoths 10,000 years ago.
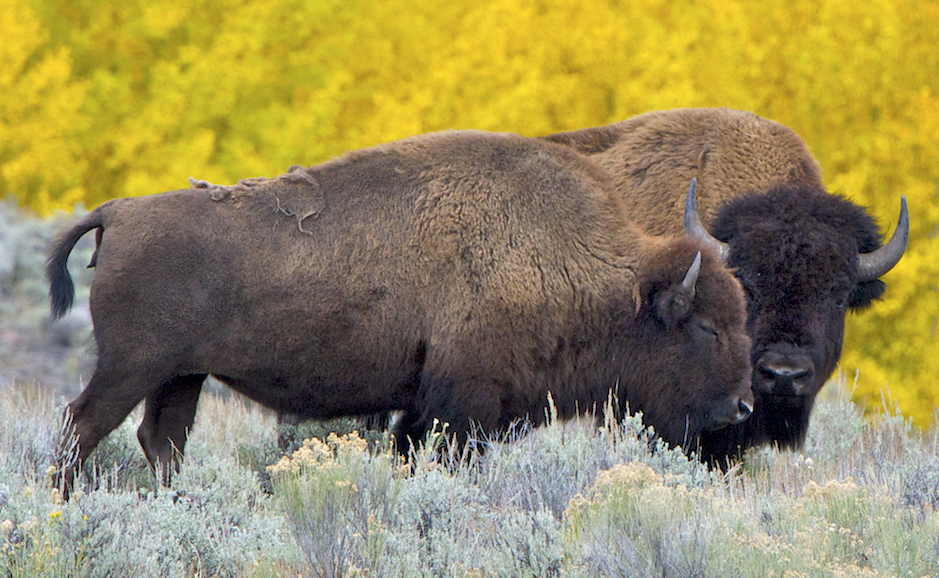
With modern hunting methods, this process has accelerated. In the 1800s, the American Bison was nearly hunted to extinction. Their numbers were reduced from 60,000,000 to just a few hundred animals by 1900. (source: Wikipedia). Under subsequent protection, they now number about 500,000.
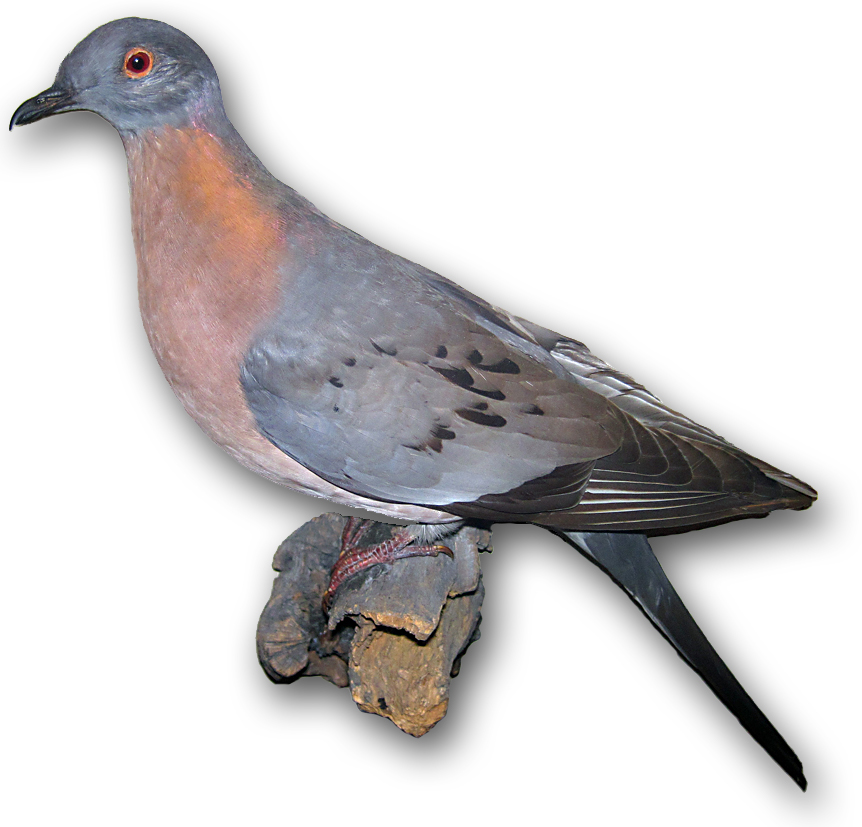
A North American bird called the passenger pigeon was once thought to be the most abundant bird in the world. Witnesses from the 1800s reported how it could take hours for a single flock to pass overhead. Overhunting led this species to become extinct in 1914 when the last surviving Passenger Pigeon died in the Cincinnati Zoo.
Other animals that have become extinct because of overharvesting include:
- The Stellar’s Sea Cow (a northern relative of the manatee, extinct since 1768)
- The Bubal Hartebeest (an antelope that lived in Northern Africa and the Middle East, extinct since the mid-1900s).
- The Pyrenean Ibex (a wild goat that lived in the Pyrenees Mountains between Spain and France, extinct since 2000).
- The Western Black Rhino. This rhinoceros population was hunted to extinction within the last decade. Rhinos are killed for their horns, which are used in traditional Chinese and Vietnamese medicine. There are five existing rhinoceros species, and all are endangered.
Animals that have been killed for predator control include:
- The Grizzly Bear: The last Grizzly in California was killed in 1922. Ironically, California’s official animal is the Grizzly bear.
- The Gray Wolf: The gray wolf was wiped out in the lower 48 states in 1926. However, wolves were reintroduced into Yellowstone National Park in 1995.
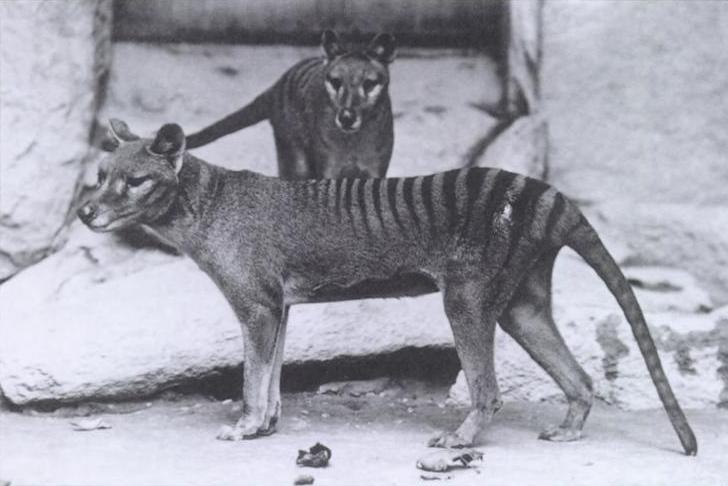
- The Tasmanian Wolf: The Tasmanian wolf, which lived in New Guinea, Australia, and Tasmania, became extinct in the 1930s.
While there’s a growing movement for sustainable fishing, many fish stocks have been overexploited. According to the Food and Agriculture Organization of the United Nations, “the state of marine fishery resources…has continued to decline.” Whereas the proportion of sustainable fish stocks was 90% in 1974, that number fell to 65.8% in 2017.
2. Introduced/Invasive Species
Introduced species (also known as non-native or exotic species) are species that were moved intentionally or accidentally from one location to another. In that new area, freed from the controls that kept their population in check, they often grow exponentially. If that’s the case, they become biological invaders: invasive species.
A few characteristics predispose species to becoming invaders. See if you can complete the following table.
[qwiz qrecord_id=”sciencemusicvideosMeister1961-Traits of invasive species (v2.0)”]
[h]Traits of invasive species
[q labels = “top”]
- ________ growth
- Rapid ________________.
- High ____________ ability
- _____________ plasticity: able to alter their ________ to suit current _____________.
- ____________ of a wide range of environmental conditions.
- For animals, an ability to live off of a _______ range of food types (____________, rather than a specialist)
[l]conditions
[fx] No. Please try again.
[f*] Correct!
[l]dispersal
[fx] No, that’s not correct. Please try again.
[f*] Correct!
[l]form
[fx] No, that’s not correct. Please try again.
[f*] Great!
[l]generalist
[fx] No, that’s not correct. Please try again.
[f*] Great!
[l]Phenotypic
[fx] No. Please try again.
[f*] Great!
[l]Rapid
[fx] No. Please try again.
[f*] Good!
[l]reproduction
[fx] No. Please try again.
[f*] Great!
[l]Tolerance
[fx] No, that’s not correct. Please try again.
[f*] Correct!
[l]wide
[fx] No. Please try again.
[f*] Correct!
[/qwiz]
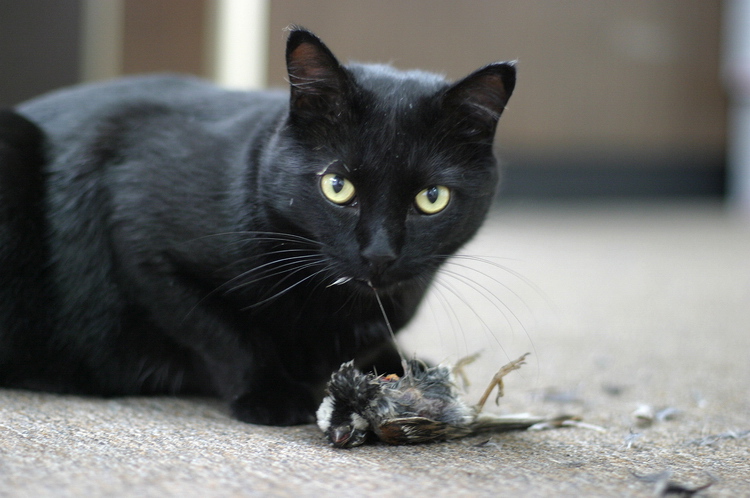
You don’t have to look far to find invasive species. They’re everywhere. If you have a house cat, then you own a particularly destructive invasive species. House cats kill between 1.3–4.0 billion birds and 6.3–22.3 billion mammals annually. These kills are both by pets and feral cats (cats without an owner that live on their own). Source: Nature Communications, The American Bird Conservancy.
Rats are another invasive species. They’re responsible for 40 to 60 percent of all bird and reptile extinctions on islands. (source) The famously extinct Dodo bird of the island of Mauritius, once thought to have been hunted to death by Dutch sailors who first reached the island in the 1600s, was probably done in by rats, which raided Dodo nests and destroyed their eggs.
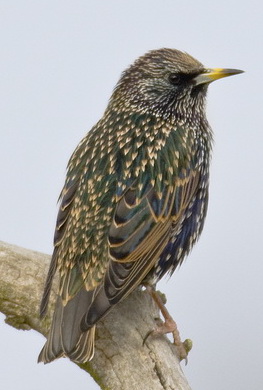
While birds are often the victims of invasive species, certain bird species are also invasive. The European Starling was released into New York’s Central Park by Shakespeare enthusiasts in the 1890s (because starlings are mentioned in Shakespeare’s plays). Now there are 200 million starlings in North America. They compete with native birds for nest sites, and with other insect-eating birds for food.
The House Sparrow, one of the most commonly seen birds in North America, is another invasive bird species. These birds were introduced into Brooklyn, New York, in 1851. Additional introductions occurred in San Francisco and Salt Lake City in the 1870s. Since 1900, they’ve been established in all of the lower 48 states.

Amphibians are the vertebrate clade that’s experiencing the highest rate of extinction, with over 40% of the world’s 8000 species listed as threatened or endangered. Why? The main cause is an invasive fungal pathogen called Batrachochytrium dendrobatidis (Bd). To learn how this fungus harms amphibians, read this passage from a reporty by Australia’s Department of Sustainability,
The fungus invades the surface layers of the frog’s skin, causing damage to the outer keratin layer. Amphibian skin is unique because it is physiologically active, allowing the skin to tightly regulate respiration, water, and electrolytes. It is not yet known exactly how the fungus kills amphibians but it is thought that it may cause mortality by disrupting the normal function of the skin resulting in electrolyte depletion and osmotic imbalance.
Bd has caused declines in 500 amphibian species worldwide and has driven dozens to extinction. The map above shows the extent of amphibian decline worldwide.
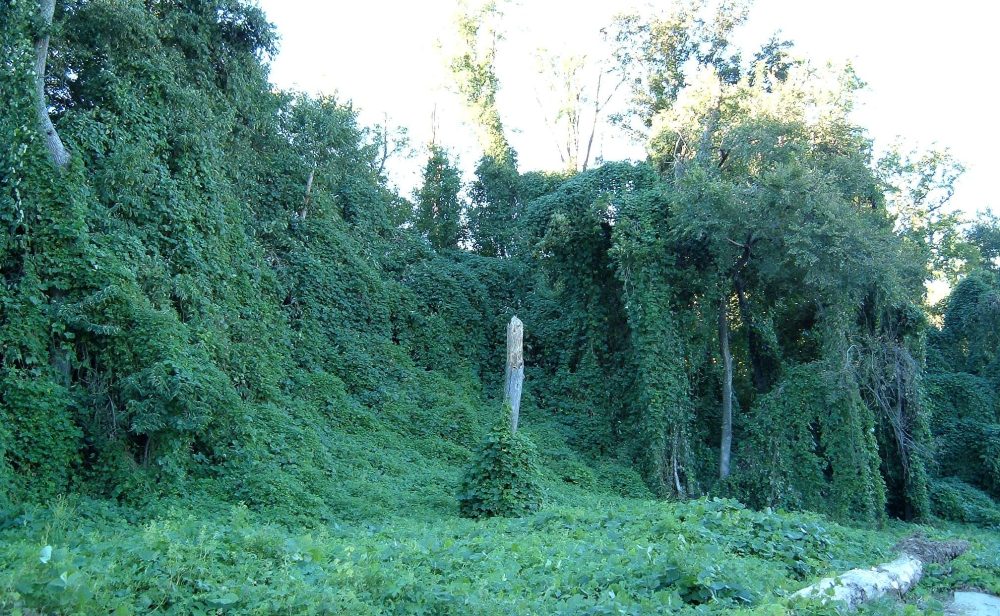
Plants can be invasive, too. As they spread, they can overrun entire ecosystems, out-competing native plants and disrupting food webs, causing biodiversity losses. The image on the left shows one invasive plant called kudzu. Kudzu, which originated in Asia, was promoted as an ornamental plant and later grown for forage (food for animals) in the southeastern United States. Millions of acres were deliberately planted to reduce soil erosion in deforested areas. But with an ability to grow up to a foot each day, kudzu has overgrown entire forests.
Invasive species can cause huge agricultural losses.
- The Asian Citrus Psyllid is a gnat-sized insect. It carries a bacterium that causes citrus greening, a disease that kills citrus trees.
- The European Gypsy Moth is originally from France. It was introduced into the United States in the 1890s. Its caterpillars devour budding leaves, which can weaken and kill a variety of trees such as oaks, maples, apples, aspens, willow, birch, and pine. Its relative, the Asian Gypsy moth, has recently been detected in Washington State, Oregon, Oklahoma, and South Carolina. With a wider host range than its European cousin, it’s feared that the Asian Gypsy moth could cause significant damage throughout the United States and Canada.
- Cryphonectria parasitica is a parasitic fungus that attacks chestnut trees, causing a disease called chestnut blight. Introduced into the United States in the 1900s, it killed an estimated 4 billion chestnut trees. These trees were habitats for many native species of birds, insects, etc, so the loss of chestnuts had cascading ecological effects.
3. Overharvest, Overhunting, Introduced and Invasive Species Flashcards
[qdeck bold_text=”false” qrecord_id=”sciencemusicvideosMeister1961-Overhunting, Invasive Species Flashcards”]
[h] Overharvest, Overhunting, and Invasive Species Flashcards
[i]Biohaiku
Pretty little cat
Fearsome, introduced species
Such avian loss
[q] What human behavior has caused many species to go extinct, even thousands of years ago?
[a] Overhunting or overharvesting by humans has caused many extinctions, including species like woolly mammoths.
[q] Why are modern methods of hunting and fishing more dangerous to biodiversity?
[a] Modern technology allows humans to hunt and fish more efficiently, making it easier to deplete species populations quickly and unsustainably.
[q] What are introduced species?
[a] Species that have been moved—accidentally or intentionally—from their native habitat to a new area.
[q] What makes an introduced species become invasive?
[a] If the introduced species grows rapidly and disrupts the local ecosystem—often because it has no natural predators or competitors—it becomes invasive.
[q] Why are invasive species a threat to biodiversity?
[a] They outcompete native species, prey on them, or disrupt food webs, leading to population declines and extinctions.
[q] List some general traits of invasive species.
[a] They often have traits like rapid reproduction, high dispersal ability, and few predators in their new habitat.
[q] What is phenotypic plasticity, and why does it help invasive species?
[a] Phenotypic plasticity is the ability to change form or behavior based on environmental conditions. This flexibility helps invasive species survive in a wide range of habitats.
[q] How do invasive species affect agriculture?
[a] Invasive pests and pathogens can damage crops or trees, causing huge agricultural and economic losses.
[/qdeck]
4. Invasive Species Case Study: The Japanese Barberry
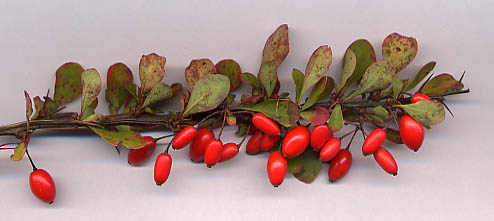
Let’s look in a bit more detail at how an invasive plant species, the Japanese Barberry, can have effects that cascade throughout an ecosystem.
The Japanese Barberry, a shrub with green leaves and bright red fruit, was introduced to North America as an ornamental plant in 1975. It soon began to spread, growing in dense, prickly thickets.
Unlike other shrubs, the barberry is avoided by deer, enabling it to grow without any top-down control.
In a recent study, Japanese barberry was found to reduce the number of arthropod herbivores (such as insect larvae or caterpillars) and predators (such as spiders). Species richness was “significantly lower in the leaf litter around the Japanese barberry and on the … plants themselves.” Compared to otherwise similar landscapes that had not been invaded, the barberry-infested community structure is much less complex, a process known as “trophic downgrading.”
Use the interactive diagram below and the questions that follow it to demonstrate your understanding of the Japanese Barberry’s effect on biodiversity. The term detritivore refers to an organism that eats detritus — leaves and other organic material that falls to the ground.
[qwiz style=”width: 700px !important; min-height: 700px !important;” qrecord_id=”sciencemusicvideosMeister1961-Interactive Case Study: The Japanese Barberry (v2.0)”]
[h] Interactive Case Study: The Japanese Barberry
[q labels = “top”]In the diagram below, label the lines and the trophic levels.
[l]detritivore
[f*] Excellent!
[fx] No, that’s not correct. Please try again.
[l]direct effects
[f*] Correct!
[fx] No. Please try again.
[l]indirect effects
[f*] Great!
[fx] No, that’s not correct. Please try again.
[l]herbivore
[f*] Correct!
[fx] No. Please try again.
[l]leaf litter
[f*] Correct!
[fx] No. Please try again.
[l]leaves
[f*] Correct!
[fx] No, that’s not correct. Please try again.
[l]predator
[f*] Great!
[fx] No, that’s not correct. Please try again.
[q]Let’s summarize. Lines 1, 2, 4, and 5 are showing the [hangman] effects of the Japanese Barberry. These include [hangman] the biomass and richness of the [hangman] in niche A. The effect is the same upon the detritivores in niche B. That creates an [hangman] effect upon the [hangman] in niche C. Together, these effects add up to an overall decrease in [hangman].
[c]ZGlyZWN0[Qq]
[c]ZGVjcmVhc2luZw==[Qq]
[c]aGVyYml2b3Jlcw==[Qq]
[c]aW5kaXJlY3Q=[Qq]
[c]cHJlZGF0b3Jz[Qq]
[c]YmlvZGl2ZXJzaXR5[Qq]
[q]Here’s a graph of arthropod abundance among Japanese Barberry and native shrubs. Abundance, ecologically speaking, is the number of individuals/species. Based on what you’ve read above, which letter represents the Japanese Barberry?
[textentry single_char=”true”]
[c]IE E=[Qq]
[f]IENvcnJlY3QuIEFidW5kYW5jZSBpcyBzaWduaWZpY2FudGx5IGxvd2VyIGluIEEsIGFuZCB0aGF0JiM4MjE3O3Mgd2hhdCB3ZSYjODIxNztkIGV4cGVjdCBmcm9tIHRoZSBkaXZlcnNpdHkgaW1wYWN0cyBjYXVzZWQgYnkgYW4gaW52YXNpdmUgc3BlY2llcyBsaWtlIHRoZSBKYXBhbmVzZSBCYXJiZXJyeS4=[Qq]
[c]IEVudGVyIHdvcmQ=[Qq]
[c]ICo=[Qq]
[f]IE5vLiBXZSYjODIxNztkIGV4cGVjdCB0aGF0IG5hdGl2ZSBzcGVjaWVzIHdvdWxkIGhhdmUgbW9yZSBiaW9kaXZlcnNpdHkgdGhhbiBpbnZhc2l2ZSBzcGVjaWVzLiBJZiB0aGF0JiM4MjE3O3MgdGhlIGNhc2UsIHdoaWNoIGxldHRlciByZXByZXNlbnRzIHRoZSBpbnZhc2l2ZSBCYXJiZXJyeSBwbGFudD8=[Qq]
[q multiple_choice=”true”]In the graph below the difference between data points “A” and “B” is significant
[c]YmVjYXVzZSBpdCYjODIxNztzIGEgcmVhbGx5IGJpZyBkaWZmZXJlbmNl[Qq]
[f]Tm8uIEl0JiM4MjE3O3Mgbm90IHRoZSBzaXplIG9mIHRoZSBkaWZmZXJlbmNlIGJldHdlZW4gdHdvIHNldHMgb2YgZGF0YSB0aGF0IGRldGVybWluZXMgd2hldGhlciB0aGUgZGlmZmVyZW5jZSBpcyBzdGF0aXN0aWNhbGx5IHNpZ25pZmljYW50IG9yIG5vdC4=[Qq]
[c]YmVjYXVzZSB0aGUgbWVhbiB2YWx1ZSBhdCAmIzgyMjA7QSYjODIyMTsgaXMgbW9yZSB0aGFuIDAuNSB1bml0cyBsb3dlciB0aGFuIHRoZSB2YWx1ZSBhdCAmIzgyMjA7Qi4mIzgyMjE7[Qq]
[f]Tm8uIEl0JiM4MjE3O3Mgbm90IHRoZSBzaXplIG9mIHRoZSBkaWZmZXJlbmNlIGJldHdlZW4gdHdvIHNldHMgb2YgZGF0YSB0aGF0IGRldGVybWluZXMgd2hldGhlciB0aGUgZGlmZmVyZW5jZSBpcyBzdGF0aXN0aWNhbGx5IHNpZ25pZmljYW50IG9yIG5vdC4gSGVyZSYjODIxNztzIGEgaGludDogTG9vayBhdCBob3cgdGhlIGF1dGhvcnMgYXJlIGdyYXBoaW5nIHRoZSBkYXRhLiBMb29rIGF0IHRoZSBlcnJvciBiYXJzLg==[Qq]
[c]YmVjYXVzZSB0aGVyZSYjODIxNztzIG5vIG92ZXJsYXAgYmV0d2VlbiB0aGUgZXJyb3IgYmFycyBhdCAmIzgyMjA7QSYjODIyMTsgYW5kIC YjODIyMDtCLCYjODIyMTsgaW5kaWNhdGluZyB0aGF0IHRoZSBkaWZmZXJlbmNlIHdhcyBzdGF0aXN0aWNhbGx5IHNpZ25pZmljYW50Lg==[Qq]
[f]VGhhdCYjODIxNztzIGV4YWN0bHkgcmlnaHQuIFdoZW4gdGhlcmUmIzgyMTc7cyBubyBvdmVybGFwIGJldHdlZW4gdGhlIGVycm9yIGJhcnMsIGl0IG1lYW5zIHRoYXQgdGhlIGRpZmZlcmVuY2Ugd2FzIHN0YXRpc3RpY2FsbHkgc2lnbmlmaWNhbnQu[Qq]
[q]A correct interpretation of the graph below is that as the density of Japanese barberry [hangman], arthropod abundance [hangman]. And, based on the error bars in the graph, we know that the difference is statistically [hangman] because there’s no [hangman].
[c]aW5jcmVhc2Vz[Qq]
[c]ZGVjcmVhc2U=[Qq]
[c]c2lnbmlmaWNhbnQ=[Qq]
[c]b3ZlcmxhcA==[Qq]
[/qwiz]
5. Threats to Biodiversity Quiz 2
[qwiz qrecord_id=”sciencemusicvideosMeister1961-Threats to Biodiversity, Quiz 2 (v2.0)”]
[h]Threats to Biodiversity, Quiz 2
[i]
[q]The American Bison and the passenger pigeon are examples of species that have suffered from [hangman].
[c]b3Zlcmh1bnRpbmc=[Qq]
[q]California Grizzly bears, the Gray Wolf, and the Tasmanian wolf were hunted to extinction or the brink of extinction in the name of [hangman] control.
[c]cHJlZGF0b3I=[Qq]
[q]When an introduced species starts to grow exponentially in its new environment, it can become what’s called a(n) [hangman] species. Such species often have very high rates of [hangman].
[c]aW52YXNpdmU=[Qq]
[c]cmVwcm9kdWN0aW9u[Qq]
[q]One of the most destructive invasive species in North America is the [hangman], which is commonly owned as a pet. These animals are responsible for the death of over a [hangman] birds every year.
[c]aG91c2VjYXQ=[Qq]
[c]YmlsbGlvbg==[Qq]
[q]Most invasive species can make a living from many food sources, rather than one. In other words, they tend to be [hangman], rather than the more specialized native species that they often outcompete.
[c]Z2VuZXJhbGlzdHM=[Qq]
[q labels = “top”]The diagram below shows the effect of the fox, which is an invasive species in Australia, upon the quoll, a marsupial that’s native to Australia. Based on the diagram, the quoll is a __________ consumer. Therefore it’s in _____________ with the fox for resources. The fox has a ________ impact on the grasshopper and the dragonfly. Its effect upon the quoll is ________. Because the fox and the quoll share a large part of their ecological _________, the principle of competitive __________ suggests that only one of them will survive. Because it can take a _________ variety of prey, the winner of this competition will probably be the fox. Again we see how the effect on an invasive species is to reduce ____________.
[l]biodiversity
[fx] No, that’s not correct. Please try again.
[f*] Great!
[l]competition
[fx] No. Please try again.
[f*] Correct!
[l]direct
[fx] No. Please try again.
[f*] Correct!
[l]exclusion
[fx] No, that’s not correct. Please try again.
[f*] Good!
[l]indirect
[fx] No, that’s not correct. Please try again.
[f*] Good!
[l]niche
[fx] No. Please try again.
[f*] Correct!
[l]tertiary
[fx] No. Please try again.
[f*] Excellent!
[l]wider
[fx] No, that’s not correct. Please try again.
[f*] Great!
[q multiple_choice=”true”]When introduced into a new area, the most likely thing that an invasive species will do is
[c]aW50ZXJicmVlZCB3aXRoIGNsb3NlbHkgcmVsYXRlZCBuYXRpdmUgc3BlY2llcw==[Qq]
[f]Tm8uIEl0JiM4MjE3O3MgdW5saWtlbHkgdGhhdCB0aGUgaW52YWRlciB3b3VsZCBiZSBjbG9zZWx5IHJlbGF0ZWQgZW5vdWdoIHRvIGEgbmF0aXZlIHRvIGludGVyYnJlZWQu[Qq]
[c]aW50ZWdyYXRlIHRoZW1zZWx2ZXMgaW50byBleGlzdGluZyBmb29kIHdlYnMsIGtlZXBpbmcgdGhvc2UgZm9vZCB3ZWJzIGludGFjdC4=[Qq]
[f]Tm8uIFJlbWVtYmVyIHRoYXQgaW52YXNpdmUgc3BlY2llcyBnZW5lcmFsbHkgY2F1c2UgYmlvZGl2ZXJzaXR5IGxvc3Nlcy4gV2hpY2ggb2YgdGhlIGNob2ljZXMgd291bGQgaW5kaWNhdGUgdGhhdD8=[Qq]
[c]Z3JvdyBleHBvbmVudGlhbGx5IGFuZCBv dXRjb21wZXRlIG5hdGl2ZSBzcGVjaWVz[Qq]
[f]TmljZSBqb2IuIEludmFzaXZlIHNwZWNpZXMgdGVuZCB0byBncm93IGV4cG9uZW50aWFsbHkgYW5kIG91dGNvbXBldGUgbmF0aXZlIHNwZWNpZXMu[Qq]
[c]ZGV2ZWxvcCBzeW1iaW90aWMgcmVsYXRpb25zaGlwcyB3aXRoIHNwZWNpZXMgdGhhdCBoYXZlIGNvbXBsZW1lbnRhcnkgYWRhcHRhdGlvbnMu[Qq]
[f]Tm8uIFJlbWVtYmVyIHRoYXQgaW52YXNpdmUgc3BlY2llcyBnZW5lcmFsbHkgY2F1c2UgYmlvZGl2ZXJzaXR5IGxvc3Nlcy4gV2hpY2ggb2YgdGhlIGNob2ljZXMgd291bGQgaW5kaWNhdGUgdGhhdD8=[Qq]
[q]Invasive species like the Japanese Barberry are said to cause trophic “downgrading.” This is another way of saying that the communities that are invaded become [hangman] complex.
[c]bGVzcw==[Qq]
[q]By reducing the populations of their competitors and prey, invasive species can force native species to enter an extinction [hangman] that can be hard to escape from.
[c]dm9ydGV4[Qq]
[/qwiz]
5. What’s Next?
Proceed to the next tutorial, Disruptions to Ecosystems, Part 3: Eutrophication and Biomagnification