1. Eukaryotic Transcription, the Big Picture
In the last tutorial, we learned that one major difference in gene regulation between prokaryotes and eukaryotes involves epigenetic modification of DNA that occurs in eukaryotes only.
There are also differences related to the control of transcription between prokaryotes and eukaryotes.
In prokaryotes, transcriptional control, at its most basic level, can be explained by the model below. RNA polymerase (3, below) starts by binding at a promoter (1). The promoter is a sequence of DNA that signals to RNA polymerase that this is where transcription should start. Once joined to the promoter, RNA polymerase transcribes the template DNA (at 5) into RNA (at 2). Transcription continues until the RNA polymerase reaches a terminator sequence (not shown in the diagram below).
We’ve also seen how prokaryotes control transcription through regulatory genes and proteins that control operons.
Eukaryotes don’t use operons to control transcription. But eukaryotes do control transcription through a variety of regulatory molecules that interact with RNA polymerase at the promoter to stimulate or inhibit transcription. A model of eukaryotic transcriptional control is shown below.
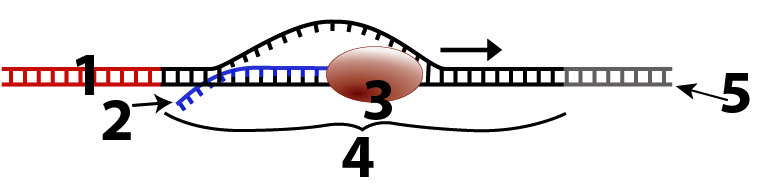
Eukaryotic promoters (1) often begin with a highly conserved DNA sequence called a TATA box (2). Highly conserved means that it stems from a common ancestor, and is found in all of that ancestral species’ descendants.
The name TATA box comes from the fact that this sequence, found in many eukaryotic genes, begins with TATAAA. Between 25 and 35 bases later is the point where transcription starts (the first DNA base that will be transcribed into RNA). This is indicated by number 3. Following the promoter is the template DNA (at 4). This is the DNA that gets transcribed into RNA.
Before RNA polymerase can bind with the promoter, a team of general transcription factors (5) has to bind with the promoter. General transcription factors bind to most promoters, often at the TATA Box.
Once these general transcription factors are in place, RNA polymerase (6) binds. But transcription won’t begin until additional transcription factors (7) bind. Once all of this is in place, RNA polymerase will begin to transcribe the DNA into RNA (8).
The combined array of RNA polymerase plus transcription factors is called a transcription initiation complex.
Eukaryotic transcription factors provide eukaryotes with a finer level of control than the epigenetic modifications discussed in the previous tutorial. Consider, for example, a nerve cell. While epigenetic modifications such as methylation may have turned many (or even most) of its genes off, hundreds of its genes are still available for transcription. The specifics of which genes in this nerve cell are transcribed at any one moment are controlled by transcription factors, which can come from within the cell, from neighboring cells, or from cells in distant parts of the body. Put this all together, and we begin to see the outline of a system that enables eukaryotic cells and tissues to both specialize and respond to the internal and external environment.
2. Checking Understanding: Transcription and the Transcription Initiation Complex
[qwiz random = “true” qrecord_id=”sciencemusicvideosMeister1961-Transcription and the transcription initiation complex (v2.0)”] [h]
Transcription and the transcription initiation complex
[i]
[q] In the diagram below, number 1 is the [hangman]
[c]IHByb21vdGVy[Qq]
[f]IEdyZWF0IQ==[Qq]
[q] In the diagram below, number 3 is RNA [hangman]
[c]IHBvbHltZXJhc2U=[Qq]
[f]IEdyZWF0IQ==[Qq]
[q] In the diagram below, the TATA box is at
[textentry single_char=”true”]
[c]ID I=[Qq]
[f]IEV4Y2VsbGVudC4gVGhlIEEtVC1yaWNoIHJlZ2lvbiBhdCB0aGUgc3RhcnQgb2YgdGhlIHByb21vdGVyIGlzIGtub3duIGFzIHRoZSBUQVRBIGJveC4=[Qq]
[c]IEVudGVyIHdvcmQ=[Qq]
[f]IE5vLCB0aGF0JiM4MjE3O3Mgbm90IGNvcnJlY3Qu[Qq]
[c]ICo=[Qq]
[f]IE5vLiBUaGUgVEFUQSBib3ggaXMgcmljaCBpbiBhZGVuaW5lIGFuZCB0aHltaW5lIGJhc2UgcGFpcnMu[Qq]
[q] In the diagram below, the template DNA is at
[textentry single_char=”true”]
[c]ID Q=[Qq]
[f]IE5pY2Ugam9iLiAmIzgyMjA7NCYjODIyMTsgaXMgdGhlIHRlbXBsYXRlIEROQS4=[Qq]
[c]IEVudGVyIHdvcmQ=[Qq]
[f]IE5vLCB0aGF0JiM4MjE3O3Mgbm90IGNvcnJlY3Qu[Qq]
[c]ICo=[Qq]
[f]IE5vLiBUaGUgdGVtcGxhdGUgRE5BIGlzIHRoZSBzdHJhbmQgb2YgRE5BIHRoYXQmIzgyMTc7cyB0cmFuc2NyaWJlZCBpbnRvIFJOQS4gSWYgOCBpcyBSTkEsIHRoZW4gd2hhdCBoYXMgdG8gYmUgdGhlIHRlbXBsYXRlIHN0cmFuZCBvZiBETkE/[Qq]
[q] In the diagram below, a general transcription factor is shown at
[textentry single_char=”true”]
[c]ID U=[Qq]
[f]IFdheSB0byBnby4gJiM4MjIwOzUmIzgyMjE7IGlzIGEgZ2VuZXJhbCB0cmFuc2NyaXB0aW9uIGZhY3Rvci4=[Qq]
[c]IDc=[Qq]
[f]IE5vLCBidXQgeW91JiM4MjE3O3JlIG9uIHRoZSByaWdodCB0cmFjay4gJiM4MjIwOzcmIzgyMjE7IGlzIGEgdHJhbnNjcmlwdGlvbiBmYWN0b3IsIGJ1dCBpdCYjODIxNztzIGJpbmRpbmcgZmFpcmx5IGxhdGUgaW4gdGhlIHByb2Nlc3MuIEZpbmQgYSB0cmFuc2NyaXB0aW9uIGZhY3RvciB0aGF0IHNob3dzIGJpbmRpbmcgYmVmb3JlIFJOQSBwb2x5bWVyYXNlIGFycml2ZXMu[Qq]
[c]ICo=[Qq]
[f]IE5vLiBGaW5kIHNvbWV0aGluZyB0aGF0IGJpbmRzIHRvIHRoZSBETkEgYmVmb3JlIFJOQSBwb2x5bWVyYXNlIChhbmQgbWFrZXMgdGhhdCBiaW5kaW5nIHBvc3NpYmxlKS4=[Qq]
[q] In the diagram below, RNA polymerase is shown at
[textentry single_char=”true”]
[c]ID Y=[Qq]
[f]IE5pY2UuICYjODIyMDs2JiM4MjIxOyBpcyBSTkEgcG9seW1lcmFzZS4=[Qq]
[c]ICo=[Qq]
[f]IE5vLiBGaW5kIHNvbWV0aGluZyB0aGF0IGJpbmRzIHRvIHRoZSBETkEgYmVmb3JlIFJOQSBwb2x5bWVyYXNlIChhbmQgbWFrZXMgdGhhdCBiaW5kaW5nIHBvc3NpYmxlKS4=[Qq]
[q] In the diagram below, newly transcribed RNA is shown at
[textentry single_char=”true”]
[c]ID g=[Qq]
[f]IEdvb2Qgam9iLiAmIzgyMjA7OCYjODIyMTsgaXMgbmV3bHkgdHJhbnNjcmliZWQgUk5BLg==[Qq]
[c]ICo=[Qq]
[f]IE5vLiBGaW5kIHNvbWV0aGluZyBSTkEgcG9seW1lcmFzZSAoNikgaXMgc3ludGhlc2l6aW5nIGZyb20gdGhlIEROQSB0ZW1wbGF0ZS4=[Qq]
[c]IEVudGVyIGxldHRlcg==[Qq]
[/qwiz]
3. Eukaryotic Transcription Factors and Control of Gene Expression
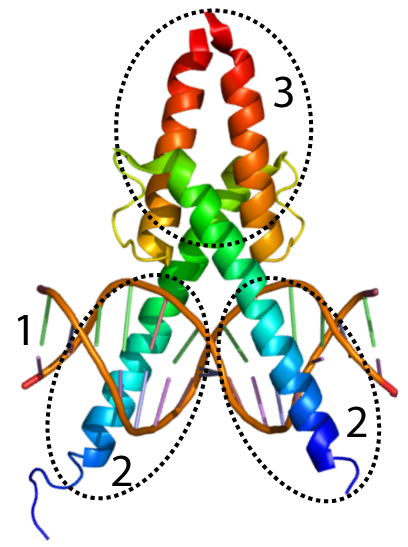
In the section above, you read about the role of transcription factors: molecules that allow RNA polymerase to bind with a promoter and start transcribing genes. Transcription factors, for the most part, are proteins. A skeletal structure of one transcription factor, MyoD, is shown on the left. MyoD plays a key role in causing certain embryonic cells to develop into muscle tissue.
To do that, MyoD has to bind with DNA. In the diagram to your left, the alpha helices shown at “2” make up a DNA binding domain. Not surprisingly, this DNA binding domain binds with DNA (shown at “1”). The alpha helices at “3” have a different function: they bind with other proteins.
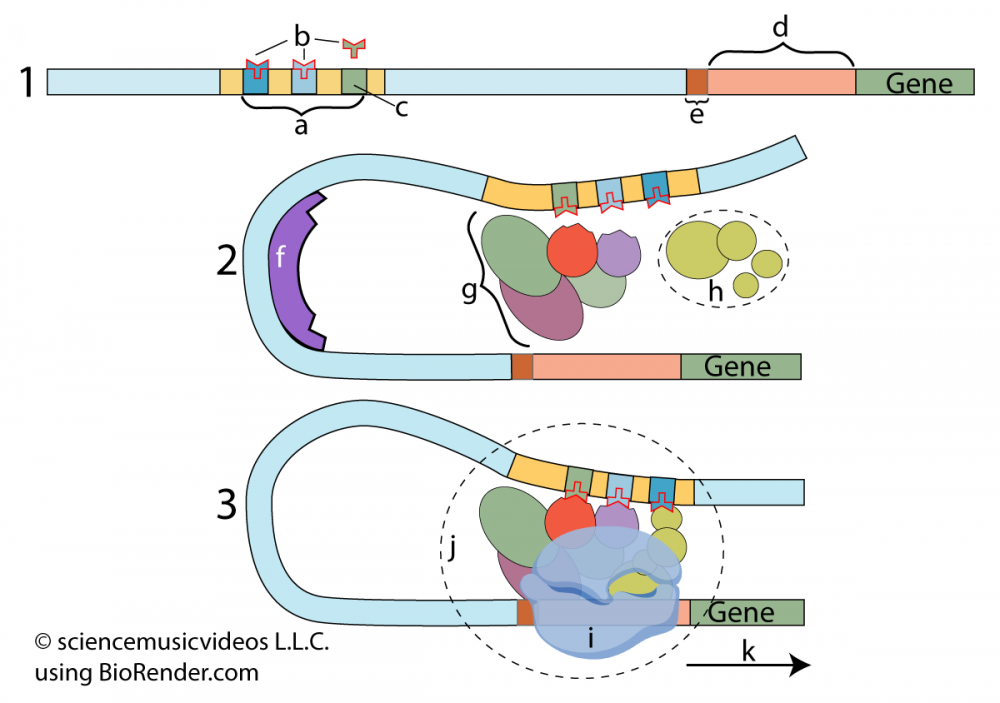 In the series of diagrams to your left, you can see a model that shows these transcription factors at work.
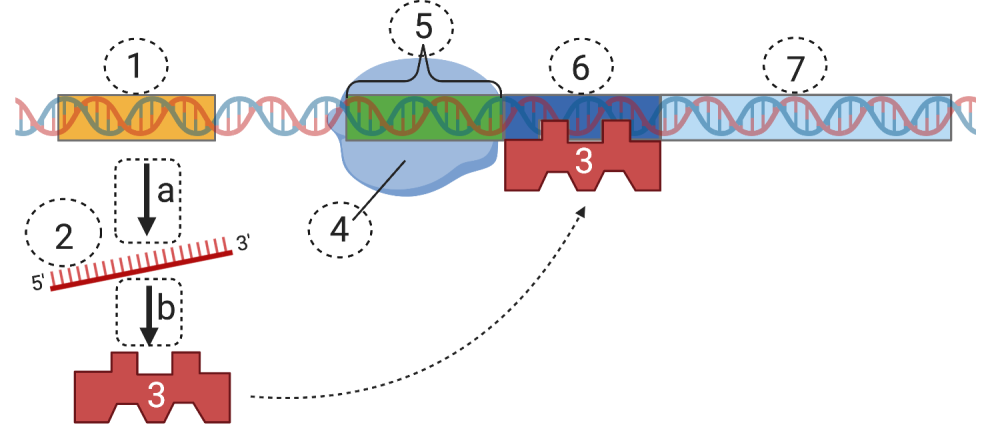
Let’s start with diagram 1: Letter “a” is a region of DNA that acts as a kind of switch that determines whether or not transcription will occur. These regions are called enhancers or regulatory switches. Note that these enhancers can be some distance away from the protein-coding region of the gene.
The enhancer (a) can be subdivided into shorter sequences of DNA called control elements, one of which is indicated by “c.” The transcription factors that bind with these control elements (shown at “b”) are often referred to as activators (because they activate genes).
Now, look at diagram 2. With these activators in place, the enhancer can bind with general transcription factors (at “h”) and additional transcription factors called mediator proteins (at “g”). If you look carefully at “g” you can see how the shape of some of these proteins was drawn to be complementary to the activators that are bound to the enhancer. On another region of the DNA, a DNA-bending protein (at “f”) bends the DNA in a way that causes the enhancer to approach the promoter.
In diagram 3, all of this comes together to form the transcription initiation complex (j). This allows RNA polymerase (i) to bind with the promoter, enabling transcription (“k”).
What’s the takeaway? Eukaryotic genes expression is controlled at several levels. The first involves epigenetic factors that were discussed in the last tutorial. In addition, within any particular cell or tissue, genes are only expressed when activator proteins (transcription factors) bind with enhancers (regulatory switches). These, in turn, bind with other proteins to form a transcription initiation complex. Once that’s happened, eukaryotic genes can be transcribed into RNA.
[qwiz random = “true” style=”width: 650px !important; min-height: 400px !important;” qrecord_id=”sciencemusicvideosMeister1961-Eukaryotic Transcription (v.2.0)”]
[h]Eukaryotic Transcription
[i]
[q] In the diagram below, which number indicates the part of the transcription factor that would interact with another transcription factor?
[textentry single_char=”true”]
[c]ID M=[Qq]
[f]IEV4Y2VsbGVudC4gTnVtYmVyICYjODIyMDszJiM4MjIxOyBpcyBhIHByb3RlaW4gYmluZGluZyBkb21haW4u[Qq]
[c]IEVudGVyIHdvcmQ=[Qq]
[f]IE5vLCB0aGF0JiM4MjE3O3Mgbm90IGNvcnJlY3Qu[Qq]
[c]ICo=[Qq]
[f]IE5vLiBKdXN0IHVzZSBhIHByb2Nlc3Mgb2YgZWxpbWluYXRpb24uIFdoaWNoIHBhcnQgaXNuJiM4MjE3O3Q=IGJpbmRpbmcgd2l0aCBETkE/[Qq]
[q] In the diagram below, which letter indicates an enhancer?
[textentry single_char=”true”]
[c]IG E=[Qq]
[f]IE5pY2Ugam9iISBUaGUgbGV0dGVyICYjODIyMDthJiM4MjIxOyBpbmRpY2F0ZXMgYW4gZW5oYW5jZXIu[Qq]
[c]IEVudGVyIHdvcmQ=[Qq]
[c]ICo=[Qq]
[f]IE5vLiBUaGUgZW5oYW5jZXIgaXMgYSBjb250cm9sIHJlZ2lvbiBsb2NhdGVkIHdheSB1cHN0cmVhbSBmcm9tIHRoZSBnZW5lLCBhbmQgaXQgY29uc2lzdHMgb2YgbXVsdGlwbGUgY29udHJvbCBlbGVtZW50cy4=[Qq]
[q] In the diagram below, which letter indicates an activator?
[textentry single_char=”true”]
[c]IG I=[Qq]
[f]IE5pY2Ugam9iLiBMZXR0ZXIgJiM4MjIwO2ImIzgyMjE7IGlzIGFuIGFjdGl2YXRvci4=[Qq]
[c]IEVudGVyIHdvcmQ=[Qq]
[c]ICo=[Qq]
[f]IE5vLiBBY3RpdmF0b3JzIGFyZSB0cmFuc2NyaXB0aW9uIGZhY3RvcnMgdGhhdCBiaW5kIHdpdGggdGhlIGVuaGFuY2VyIHJlZ2lvbi4=[Qq]
[q] In the diagram below, which letter indicates a control element?
[textentry single_char=”true”]
[c]IG M=[Qq]
[f]IEF3ZXNvbWUuIExldHRlciAmIzgyMjA7YyYjODIyMTsgaXMgYSBjb250cm9sIGVsZW1lbnQu[Qq]
[c]IEVudGVyIHdvcmQ=[Qq]
[c]ICo=[Qq]
[f]IE5vLiBDb250cm9sIGVsZW1lbnRzIGFyZSBwYXJ0cyBvZiBlbmhhbmNlcnMu[Qq]
[q] In the diagram below, which letter indicates the promoter?
[textentry single_char=”true”]
[c]IG Q=[Qq]
[f]IEdvb2Qgd29yay4gTGV0dGVyICYjODIyMDtkJiM4MjIxOyBpbmRpY2F0ZXMgdGhlIHByb21vdGVyLg==[Qq]
[c]IEVudGVyIHdvcmQ=[Qq]
[c]ICo=[Qq]
[f]IE5vLiBUaGUgcHJvbW90ZXIgaXMganVzdCB1cHN0cmVhbSBvZiB0aGUgZ2VuZS4=[Qq]
[q] In the diagram below, if “g” indicates mediator proteins. which letter indicates general transcription factors?
[textentry single_char=”true”]
[c]IG g=[Qq]
[f]IFRlcnJpZmljLiBMZXR0ZXIgJiM4MjIwO2gmIzgyMjE7IGluZGljYXRlcyBnZW5lcmFsIHRyYW5zY3JpcHRpb24gZmFjdG9ycy4=[Qq]
[c]IEVudGVyIHdvcmQ=[Qq]
[c]ICo=[Qq]
[f]IE5vLiBGaXJzdCBvZiBhbGwsIHRoZSBxdWVzdGlvbiB0ZWxscyB5b3UgdGhhdCB0aGUgYW5zd2VyIGlzIG5vdCAmIzgyMjA7Zy4mIzgyMjE7IFNlY29uZCwgbG9vayBhdCBkaWFncmFtIG51bWJlciAzLCB3aGVyZSB5b3UgY2FuIHNlZSB0aGUgZ2VuZXJhbCB0cmFuc2NyaXB0aW9uIGZhY3RvcnMgaW50ZXJhY3Rpbmcgd2l0aCBib3RoIHRoZSBwcm9tb3RlciBhbmQgUk5BIHBvbHltZXJhc2UuIElmIGl0JiM4MjE3O3Mgbm90ICYjODIyMDtnLCYjODIyMTsgdGhlbiB3aGF0IG11c3QgaXQgYmU/[Qq]
[q] In the diagram below, if “h” indicates general transcription factors, then what letter has to be mediator proteins?
[textentry single_char=”true”]
[c]IG c=[Qq]
[f]IFRlcnJpZmljLiBMZXR0ZXIgJiM4MjIwO2cmIzgyMjE7IGluZGljYXRlcyBtZWRpYXRvciBwcm90ZWlucy4=[Qq]
[c]IEVudGVyIHdvcmQ=[Qq]
[c]ICo=[Qq]
[f]IE5vLiBNZWRpYXRvciBwcm90ZWlucyBpbnRlcmFjdCB3aXRoIGFjdGl2YXRvcnMgYW5kIHdpdGggZ2VuZXJhbCB0cmFuc2NyaXB0aW9uIGZhY3RvcnMuIFdoYXQgcGFydCBhYm92ZSBpcyBkb2luZyBib3RoPw==[Qq]
[q] In the diagram below, DNA bending proteins are shown at
[textentry single_char=”true”]
[c]IG Y=[Qq]
[f]IE5pY2UuIExldHRlciAmIzgyMjA7ZiYjODIyMTsgaW5kaWNhdGVzIGEgRE5BLWJlbmRpbmcgcHJvdGVpbi4=[Qq]
[c]IEVudGVyIHdvcmQ=[Qq]
[c]ICo=[Qq]
[f]IE5vLiBMb29rIGNhcmVmdWxseSBhdCB0aGUgZGlhZ3JhbS4gV2hhdCBwYXJ0IHNlZW1zIHRvIGJlIGFzc29jaWF0ZWQgd2l0aCBiZW5kaW5nIHRoZSBETkEgc28gdGhhdCB0aGUgZW5oYW5jZXIgY29tZXMgY2xvc2UgdG8gdGhlIHByb21vdGVyPw==[Qq]
[q] In the diagram below, RNA polymerase is shown at
[textentry single_char=”true”]
[c]IG k=[Qq]
[f]IEdvb2Qgd29yay4gVGhlIGxldHRlciAmIzgyMjA7aSYjODIyMTsgaW5kaWNhdGVzIFJOQSBwb2x5bWVyYXNlLg==[Qq]
[c]IEVudGVyIHdvcmQ=[Qq]
[c]ICo=[Qq]
[f]IE5vLiBMb29rIGZvciBzb21ldGhpbmcgdGhhdCBzaXRzIHNxdWFyZWx5IG9uIHRoZSBwcm9tb3RlciAoYW5kIGl0IGxvb2tzIGEgYml0IGxpa2UgYSBndWl0YXIgcGljayku[Qq]
[q] In the diagram below, a transcription initiation complex is shown at
[textentry single_char=”true”]
[c]IG o=[Qq]
[f]IEF3ZXNvbWUuIExldHRlciAmIzgyMjA7aiYjODIyMTsgaW5kaWNhdGVzIHRoZSB0cmFuc2NyaXB0aW9uIGluaXRpYXRpb24gY29tcGxleC4=[Qq]
[c]IEVudGVyIHdvcmQ=[Qq]
[c]ICo=[Qq]
[f]IE5vLiBUaGUgdHJhbnNjcmlwdGlvbiBpbml0aWF0aW9uIGNvbXBsZXggY29uc2lzdHMgb2YgYWN0aXZhdG9ycywgbWVkaWF0b3JzLCBnZW5lcmFsIHRyYW5zY3JpcHRpb24gZmFjdG9ycywgYW5kIFJOQSBwb2x5bWVyYXNlLCByZWFkeSBmb3IgdHJhbnNjcmlwdGlvbi4=[Qq]
[x]
[restart]
[/qwiz]
4. Once eukaryotic DNA is transcribed, several steps are required before the RNA can be translated into protein
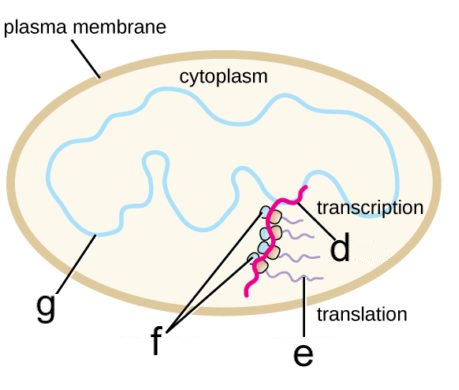
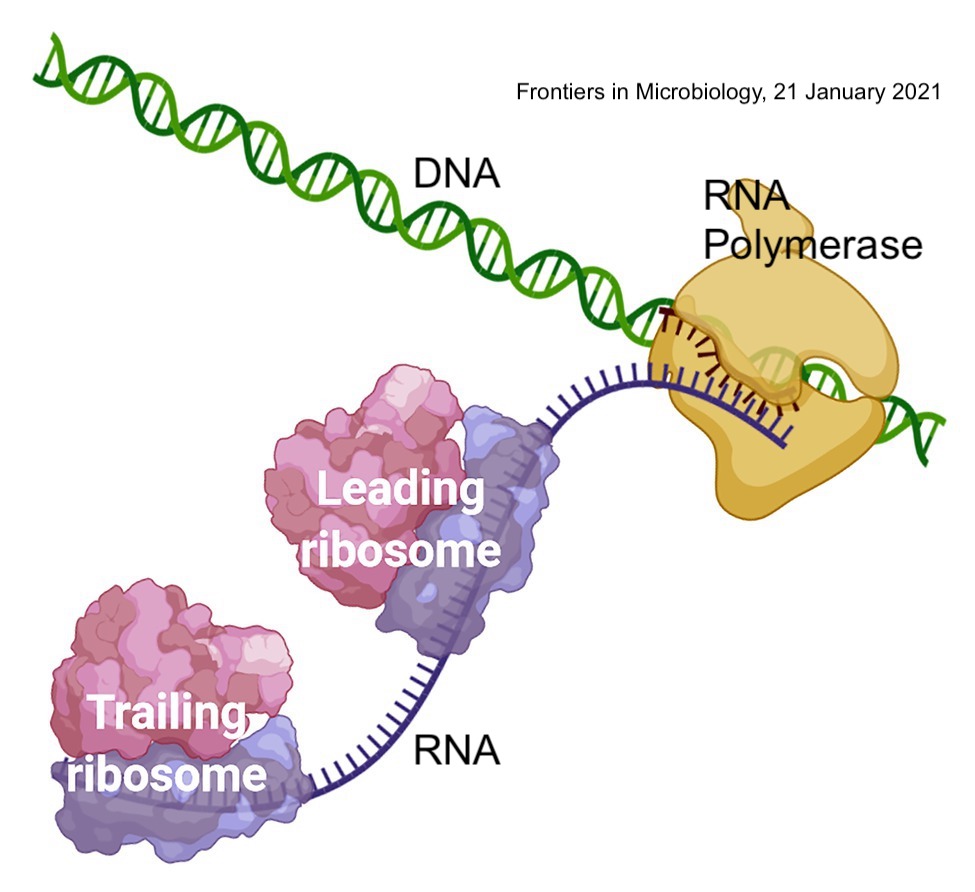
In prokaryotic cells, translation immediately follows the transcription of RNA from DNA. What that means is that while transcription has to occur first, the two processes (transcription and translation) wind up occurring at the same time. This is called coupled transcription-translation.
In the diagram on the left below, “g” represents a bacterial cell’s DNA. Letter “d” represents mRNA, which is translated by a series of ribosomes (“f”) into polypeptide chains (“e”) that will fold up into proteins. The image on the right shows a close-up view of the process (but leaves out the polypeptide chain).
|
|
|
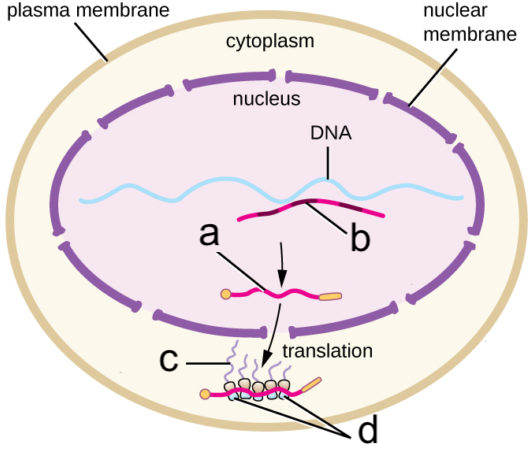 In eukaryotes, transcription and translation are separated both in terms of space and time. Spatially, transcription occurs in the nucleus. After transcription, the mRNA enters the cytoplasm, where it’s translated into protein.
In addition, several steps are required between the creation of the initial RNA transcript (“b) and mRNA that’s ready for translation (“a”).
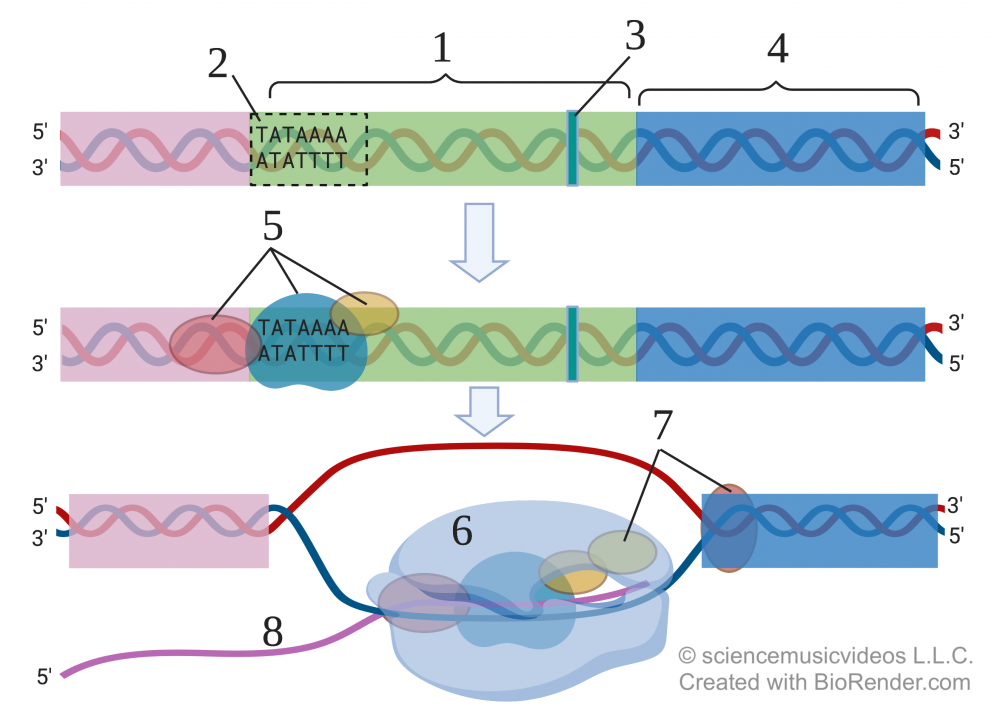
To start, let’s take a closer look at a model of eukaryotic DNA (at 1), an unmodified RNA transcript (2), and mRNA that’s ready for translation (shown below)
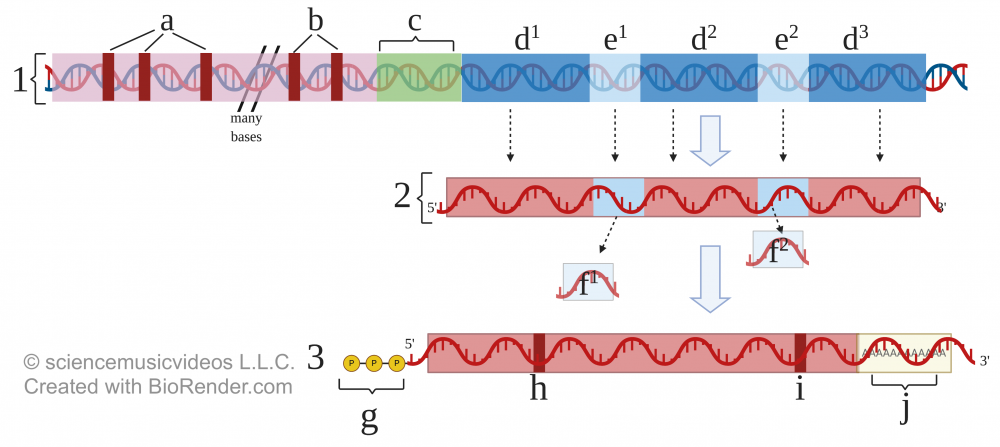
In the diagram above, the letters “a” and “b” indicate control elements in DNA. These are sequences that activators can bind to). The letter “c” represents the promoter. The gene starts at d1 and ends at d3. So what’s going on with the DNA that’s labeled e1 and e2?
Letters e1 and e2 represent sequences of non-coding DNA found within eukaryotic genes called introns. Imagine that in the middle of a sentence, every few words included a bunch of nonsense letters. Applied to the preceding sentence, here’s what that would look like:
Imagine that in the slkajfpewra;lskdjfweroj middle of a sentence, aklmre1oqw every few words included a bunch peiurpq0erI of nonsense letters.
Eukaryotic genes are similarly interrupted by sequences of nucleotide bases that do not code for protein. In fact, if these nucleotides were transcribed and translated, the function of the resulting protein would be ruined. Consequently, before translating their RNA into protein, eukaryotic cells have to edit their RNA. That editing involves removing introns and leaving only the RNA that will be expressed. Those expressed sequences have a name: exons. Just remember: exons get expressed; introns are intervening segments.
To follow what happens, look again at the “Eukaryotic RNA Processing” diagram above. Number 1 shows the template DNA. Letters d1, d2, and d3 represent exon DNA that will become messenger RNA and be coded into protein. But disrupting the exons are two introns, represented by e1 and e2.
Number 2 represents what’s called “pre-mRNA.” This transcribed RNA includes the introns, indicated by f1 and f2.
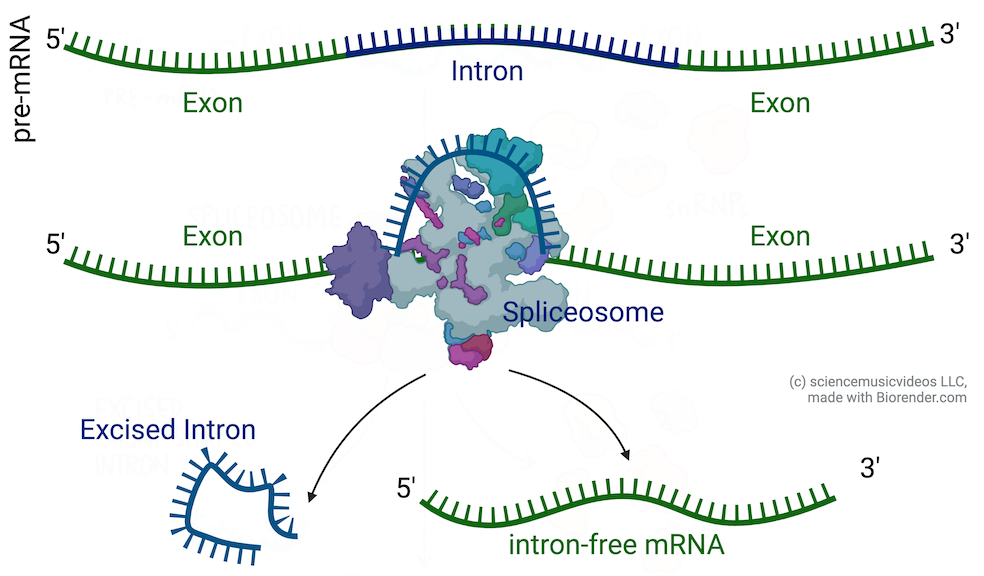
Removing the intron RNA and connecting the exons is called splicing. If you’ve ever worked with a digital video file (or with film or audiotape), you know what splicing is: you cut out the material you don’t want and connect the parts that you do want. In a eukaryotic cell, Small Nuclear RiboNuclear Proteins (abbreviated as “snRNPs” and pronounced as snurps) combine to form a molecular splicing machine called a spliceosome. Spliceosomes can find the introns, cut them out, and connect the exons.
Why does eukaryotic DNA have introns? Why hasn’t 1.8 billion years of eukaryotic evolution resulted in their deletion from eukaryotic DNA? It turns out that they’re adaptive.
 Introns allow for a process called alternative splicing. Alternative splicing relates to the fact that exons don’t have to be spliced together in the linear order in which they’re initially transcribed. The order can be changed, and exons can be dropped.
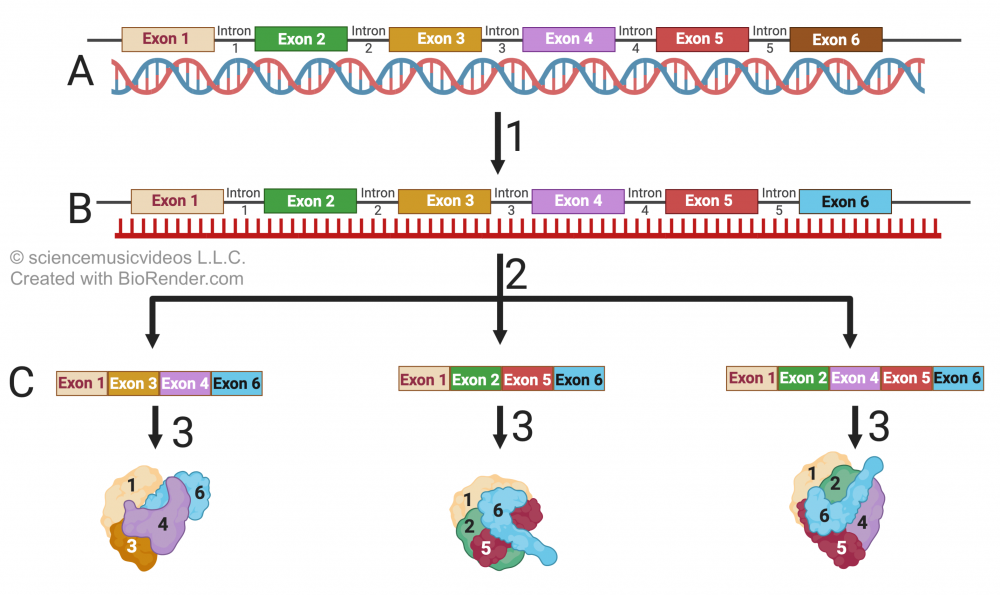
Consider the image at left. In “B” you can see a primary RNA transcript that contains 6 exons. However, alternative splicing (indicated by the arrows at number 2) generates three unique mRNAs, which get translated into three unique proteins, each of which is lacking one or more of the six exons that make up the gene. The result will be three proteins, with different three-dimensional conformations and different properties.
Alternative splicing explains why there are many more human messenger RNAs than there are genes. It’s estimated that about 80% of all human genes are alternatively spliced. Moreover, this might explain some features of human evolution. For example, while the human genome and chimpanzee genome are of equal size, there are significant differences in messenger RNA and protein that are can be attributed to alternative splicing that occurs in humans, and which doesn’t occur in chimpanzees (Principles of Life, Sinauer Associates, p. 222).
After that, two more steps are required. These are shown in step 3 in the “Eukaryotic RNA processing” diagram, shown again on the right. First, enzymes add a GTP (guanine triphosphate) “cap” to the RNA’s 5′ end (indicated by the letter “g”). At the 3′ end, other enzymes add a “tail” consisting of repeated adenine ribonucleotides. The tail is called a “poly-A tail.” Both the cap and tail help the mRNA resist enzymatic degradation while in the cytoplasm. Finally, “h” and “i” indicate the start and stop codons, respectively.
5. Eukaryotic Gene Regulation through Transcription Flashcards
[qdeck style=”width: 650px !important; min-height: 400px !important;” bold_text=”false” qrecord_id=”sciencemusicvideosMeister1961-Eukaryotic Gene Regulation through Transcription FC (v2.0)”]
[h]Eukaryotic Gene Regulation through Transcription Flashcards
[q json=”true” yy=”4″ unit=”6.Gene_Expression_and_Regulation” dataset_id=”AP_Bio_Flashcards_2022|18d2436940d10″ question_number=”220″ topic=”6.3.Transcription_and_RNA_Processing”] What is pre-mRNA? Describe some of the post-transcriptional modification that has to happen to pre-mRNA in eukaryotes before it can be translated into protein.
[a] In eukaryotic cells, pre-mRNA (2) is what’s transcribed from a protein-coding gene. Before it can be translated into protein, pre-mRNA is processed with addition of a 5’ GTP cap (“g”), a 3’ poly-A tail (j), excision of introns (“f”) and splicing together of exons.
[q json=”true” yy=”4″ unit=”6.Gene_Expression_and_Regulation” topic=”6.3.Transcription_and_RNA_Processing” dataset_id=”AP_Bio_Flashcards_2022|173d636aaee002″ question_number=”221″] What is the function of the 5′ GTP cap and the 3′ poly-A-tail that’s added to mRNA during eukaryotic RNA processing?
[a]
The 5’ GTP cap (“g”) protects the mRNA from breakdown by enzymes in the cytoplasm, and also assists the mRNA in leaving the nucleus and binding with a ribosome. The 3’ poly-A tail (j) makes the mRNA more stable and delays its enzymatic breakdown in the cytoplasm.
[q json=”true” yy=”4″ unit=”6.Gene_Expression_and_Regulation” dataset_id=”AP_Bio_Flashcards_2022|18c962fbeb910″ question_number=”222″ topic=”6.3.Transcription_and_RNA_Processing”] Describe, on a big picture level, how transcription is regulated in eukaryotes.
[a] Eukaryotes possess regulatory DNA sequences that interact with regulatory proteins to control transcription. These sequences include promoters (d) and enhancers (a). Interactions between activator proteins (b), DNA bending proteins (f), mediator proteins (g), and general transcription factors (h) enable RNA polymerase (i) to bind, making transcription possible. (Note that letter “e” is a “proximal control element.” For AP Bio, don’t worry about it!)
[q json=”true” yy=”4″ unit=”6.Gene_Expression_and_Regulation” topic=”6.3.Transcription_and_RNA_Processing” dataset_id=”AP_Bio_Flashcards_2022|ac507a8247bd” question_number=”223″]Explain how organization of eukaryotic genetic material into introns and exons can increase phenotypic variation.
[a] Through alternative splicing, exons can be spliced together in alternative ways allowing for the production of multiple protein versions from the same mRNA transcript.
[q json=”true” yy=”4″ unit=”6.Gene_Expression_and_Regulation” dataset_id=”AP_Bio_Flashcards_2022|18b2d4c8bad10″ question_number=”225″ topic=”6.4.Translation”] How are transcription and translation different in prokaryotes and eukaryotes?
[a] In prokaryotes (1), transcription and translation are coupled: protein synthesis begins while transcription of mRNA is still taking place. In eukaryotes (2), the processes of transcription and translation are spatially and temporally separate: transcription occurs in the nucleus, and translation is in the cytoplasm.
In prokaryotes, a single mRNA can code for multiple proteins within a specific metabolic pathway; in eukaryotes, the mRNA codes for only a single polypeptide. In eukaryotes, pre-mRNA is modified before translation occurs (the details of which are covered in another card).
[q json=”true” yy=”4″ unit=”6.Gene_Expression_and_Regulation” dataset_id=”AP_Bio_Flashcards_2022|18658f7e1c110″ question_number=”233″ topic=”6.5.Regulation_of_Gene_Expression”] What are transcription factors?
[a]
Transcription factors (5) are proteins that bind to DNA at or near a gene’s promoter (1). Transcription factors play a regulatory role, enhancing or inhibiting gene expression by promoting or inhibiting the binding of RNA polymerase (6)
[x][restart]
[/qdeck]
6. Quiz: Eukaryotic RNA Processing and Control of Eukaryotic Transcription
[qwiz random = “true” style=”width: 650px !important; min-height: 400px !important;” qrecord_id=”sciencemusicvideosMeister1961-Eukaryotic RNA Processing and Control of Transcription (v2.0)”]
[h]Eukaryotic RNA Processing
[i]
[q] In the diagram below, letters “a” and “b” both represent [hangman] elements, which are binding sites within an [hangman].
[c]Y29udHJvbA==
[c]ZW5oYW5jZXI=[Qq]
[q] In the diagram below, which letter indicates intron DNA (don’t worry about superscripts)?
[textentry single_char=”true”]
[c]IG U=[Qq]
[f]IE5pY2Ugam9iLiBUaGUgaW50cm9uIEROQSAoYXQgJiM4MjIwO2UmIzgyMjE7KSBiZWNvbWVzIFJOQSBpbiB0aGUgcHJlLVJOQSwgYnV0IHRoZW4gY3V0cyBjdXQgb3V0IGFzIG1STkEgaXMgZm9ybWVkLg==[Qq]
[c]IEVudGVyIHdvcmQ=[Qq]
[f]IE5vLCB0aGF0JiM4MjE3O3Mgbm90IGNvcnJlY3Qu[Qq]
[c]ICo=[Qq]
[f]IE5vLsKgVGhlIGludHJvbiBETkEgY29kZXMgZm9yIFJOQSB0aGF0IGdldHMgY3V0IG91dCBvZiB0aGUgcHJlLVJOQSBiZWZvcmUgaXQgZ2V0cyBtYWRlIGludG8gbVJOQS4gJiM4MjIwO0YmIzgyMjE7IHJlcHJlc2VudHMgdHdvIFJOQSBzZWdtZW50cyB0aGF0IGhhdmUgYmVlbiBjdXQgb3V0JiM4MjMwO3NvIGp1c3Qgd29yayB1cCBmcm9tIHRoZXJlIGFuZCB5b3UmIzgyMTc7bGwgaGF2ZSB0aGUgYW5zd2VyLsKg[Qq]
[q] In the diagram below, pre-mRNA (still with introns) is represented by the number
[textentry single_char=”true”]
[c]ID I=[Qq]
[f]IEF3ZXNvbWUuICYjODIyMDsyJiM4MjIxOyBpcyBwcmUtbVJOQS4=[Qq]
[c]IEVudGVyIHdvcmQ=[Qq]
[f]IE5vLCB0aGF0JiM4MjE3O3Mgbm90IGNvcnJlY3Qu[Qq]
[c]ICo=[Qq]
[f]IE5vLiBTcGxpY2VkIG91dCBSTkEgaW50cm9ucyBjYW4gYmUgc2VlbiBhdCAmIzgyMjA7Zi4mIzgyMjE7IA==TG9vayBmb3IgUk5BIHRoYXQgc3RpbGwgY29udGFpbnMgaW50cm9ucy7CoA==wqA=[Qq]
[q] In the diagram below, messenger RNA is represented by the number
[textentry single_char=”true”]
[c]ID M=[Qq]
[f]IEdvb2Qgd29yay4gJiM4MjIwOzMmIzgyMjE7IGlzIG1lc3NlbmdlciBSTkEu[Qq]
[c]IEVudGVyIHdvcmQ=[Qq]
[f]IE5vLCB0aGF0JiM4MjE3O3Mgbm90IGNvcnJlY3Qu[Qq]
[c]ICo=[Qq]
[f]IE5vLiBSTkEgaW50cm9ucyBjYW4gYmUgc2VlbiBpbiBudW1iZXLCoCAmIzgyMjA7Mi4mIzgyMjE7IA==TG9vayBmb3IgUk5BIGluIHdoaWNoIHRoZSBpbnRyb25zIGhhdmUgYmVlbiBzcGxpY2VkIG91dC4=[Qq]
[q] In the diagram below, the protective, 5′ GTP cap is at
[textentry single_char=”true”]
[c]IG c=[Qq]
[f]IEV4Y2VsbGVudC4gJiM4MjIwO0cmIzgyMjE7IGlzIHRoZSA1JiM4MjQyOyBHVFAgY2FwLg==[Qq]
[c]IEVudGVyIHdvcmQ=[Qq]
[f]IE5vLCB0aGF0JiM4MjE3O3Mgbm90IGNvcnJlY3Qu[Qq]
[c]ICo=[Qq]
[f]IE5vLiBIZXJlJiM4MjE3O3MgYSBoaW50LiBHVFAgaXMgYXR0YWNoZWQgdG8gbVJOQSwgYW5kIGl0IGhhcyAzIHBob3NwaGF0ZSBncm91cHMuwqA=[Qq]
[q]In the diagram below, which number represents eukaryotic transcription and translation?
[textentry single_char=”true”]
[c]ID I=[Qq]
[f]IEV4Y2VsbGVudC4gJiM4MjIwOzImIzgyMjE7IGlzIGV1a2FyeW90aWMgdHJhbnNjcmlwdGlvbiBhbmQgdHJhbnNsYXRpb24u[Qq]
[c]IEVudGVyIHdvcmQ=[Qq]
[f]IE5vLCB0aGF0JiM4MjE3O3Mgbm90IGNvcnJlY3Qu[Qq]
[c]ICo=[Qq]
[f]IE5vLiBSZW1lbWJlciB0aGF0IGluIGV1a2FyeW90ZXMsIFJOQSBoYXMgdG8gYmUgcHJvY2Vzc2VkIGJlZm9yZSBpdCBjYW4gYmUgdHJhbnNsYXRlZC4gSW4gcHJva2FyeW90ZXMsIHRoYXQmIzgyMTc7cyBub3QgbmVjZXNzYXJ5LsKg[Qq]
[q]In the diagram below, which letter represents pre-mRNA?
[textentry single_char=”true”]
[c]IG I=[Qq]
[f]IEV4Y2VsbGVudC4gJiM4MjIwO2ImIzgyMjE7IGlzIHByZS1tUk5BLg==[Qq]
[c]IEVudGVyIHdvcmQ=[Qq]
[f]IE5vLCB0aGF0JiM4MjE3O3Mgbm90IGNvcnJlY3Qu[Qq]
[c]ICo=[Qq]
[f]IE5vLiBIZXJlJiM4MjE3O3MgYSBoaW50LiBQcmUtbVJOQSBjb250YWlucyBpbnRyb25zIGFuZCBsYWNrcyBhIDUmIzgyNDI7IGNhcCBhbmQgYSBwb2x5LUEgdGFpbC7CoA==[Qq]
[q labels = “top”]
[l]introns
[f*] Excellent!
[fx] No. Please try again.
[l]mRNA
[f*] Correct!
[fx] No. Please try again.
[l]poly-A tail
[f*] Great!
[fx] No, that’s not correct. Please try again.
[l]pre-mRNA
[f*] Good!
[fx] No. Please try again.
[q labels = “top”]
[l]Alternative splicing
[f*] Great!
[fx] No. Please try again.
[l]pre-mRNA
[f*] Great!
[fx] No, that’s not correct. Please try again.
[l]transcription
[f*] Excellent!
[fx] No, that’s not correct. Please try again.
[l]translation
[f*] Great!
[fx] No. Please try again.
[q multiple_choice=”true”] Which of the statements below most closely matches what’s being depicted in the following diagram?
[c]IEV2ZXJ5IEROQSBnZW5lIGhhcyBvbmUgY29ycmVzcG9uZGluZyBwcm90ZWluIHByb2R1Y3Qu[Qq]
[f]IE5vLiBMb29rIGF0ICYjODIyMDtELCYjODIyMTsgJiM4MjIwO0UsJiM4MjIxOyBhbmQgJiM4MjIwO0YsJiM4MjIxOyBhYm92ZS4gVGhyZWUgcHJvdGVpbnMgY29tZSBmcm9tIG9uZSBnZW5lLg==[Qq]
[c]IE11bHRpcGxlIHByb3RlaW5zIGNhbiBiZS Bwcm9kdWNlZCBmcm9tIG9uZSBnZW5lLg==[Qq]
[f]IEV4YWN0bHkuIEJ5IHNodWZmbGluZyBvciBkZWxldGluZyBleG9ucywgYWx0ZXJuYXRpdmUgc3BsaWNpbmcgYWxsb3dzIG11bHRpcGxlIHByb3RlaW5zIHRvIGJlIGNyZWF0ZWQgZnJvbSBvbmUgY29kaW5nIEROQS4=[Qq]
[c]IFByb2thcnlvdGVzIGhhdmUgbW9yZSBmbGV4aWJpbGl0eSBpbiBob3cgZ2VuZXMgYXJlIGV4cHJlc3NlZCB0aGFuIGRvIGV1a2FyeW90ZXM=[Qq]
[f]IE5vLiBUaGF0JiM4MjE3O3MgcHJvYmFibHkgbm90IHRydWUgKGp1c3QgY29uc2lkZXIgdGhlIGFsdGVybmF0aXZlIHNwbGljaW5nIHNob3duIGFib3ZlKSwgYW5kLCBpdCYjODIxNztzIG5vdCBkZXBpY3RlZCBpbiB0aGUgaW1hZ2UgYWJvdmUu[Qq]
[c]TW9kaWZpY2F0aW9uIG9mIEROQSBmcm9tIGNlbGwgdG8gY2VsbCB3aXRoaW4gYSBldWthcnlvdGljIG9yZ2FuaXNtIGNhbiBlbmhhbmNlIHBoZW5vdHlwaWMgZGl2ZXJzaXR5Lg==[Qq]
[f]Tm8uIE5vdGUgdGhhdCBpdCYjODIxNztzIG5vdCB0aGUgRE5BIHRoYXQmIzgyMTc7cyBiZWluZyBtb2RpZmllZC4gVGhlIG1vZGlmaWNhdGlvbiBvY2N1cnMgYWZ0ZXIgdHJhbnNjcmlwdGlvbiwgYW5kIGl0IGludm9sdmVzIFJOQS4=[Qq]
[q] In the diagram below, 5 is a general [hangman] factor.
[c]IHRyYW5zY3JpcHRpb24=[Qq]
[f]IEdyZWF0IQ==[Qq]
[q] In the diagram below, number 2 is a [hangman] box.
[c]IFRBVEE=[Qq]
[f]IEdyZWF0IQ==[Qq]
[q] In the diagram below, number 1 is the [hangman].
[c]IHByb21vdGVy[Qq]
[f]IEdvb2Qh[Qq]
[q] In the diagram below, numbers 5, 6, and 7, arrayed at a gene’s promoter, is called a(n) [hangman] initiation complex.
[c]IHRyYW5zY3JpcHRpb24=[Qq]
[f]IEV4Y2VsbGVudCE=[Qq]
[q] In the diagram below, the three DNA elements indicated by “a” together make up an [hangman]. Another word for this same structure is a regulatory [hangman].
[c]IGVuaGFuY2Vy[Qq]
[f]IEV4Y2VsbGVudCE=[Qq]
[c]IHN3aXRjaA==[Qq]
[f]IEdyZWF0IQ==[Qq]
[q] In the diagram below, the two deleted RNA segments labeled as f1 and f2 must be [hangman]. Once these are removed (and a few other modifications are made), the result (shown at “3”) is [hangman] RNA.
[c]IGludHJvbnM=[Qq]
[f]IEV4Y2VsbGVudCE=[Qq]
[c]IG1lc3Nlbmdlcg==[Qq]
[f]IEV4Y2VsbGVudCE=[Qq]
[q] In the diagram below, “c” is a control element. Letter “a” is an [hangman]. The molecule that’s binding with “c” is an [hangman].
[c]IGVuaGFuY2Vy[Qq]
[f]IEV4Y2VsbGVudCE=[Qq]
[c]IGFjdGl2YXRvcg==[Qq]
[f]IEV4Y2VsbGVudCE=[Qq]
[q] In the diagram below, “d” is the [hangman]. Letter “f” is a DNA [hangman] protein. Letter “g” is a group of mediator proteins, and “h” is a group of general [hangman] factors. When all of these assemble on the promoter, RNA [hangman] can finally bind and transcribe the gene.
[c]IHByb21vdGVy[Qq]
[f]IENvcnJlY3Qh[Qq]
[c]IGJlbmRpbmc=[Qq]
[f]IENvcnJlY3Qh[Qq]
[c]IHRyYW5zY3JpcHRpb24=[Qq]
[f]IEdvb2Qh[Qq]
[c]IHBvbHltZXJhc2U=[Qq]
[f]IEdyZWF0IQ==[Qq]
[q labels = “top”]
[l]Activators
[fx] No. Please try again.
[f*] Good!
[l]Control Elements
[fx] No. Please try again.
[f*] Good!
[l]DNA Bending protein
[fx] No. Please try again.
[f*] Correct!
[l]Enhancer
[fx] No, that’s not correct. Please try again.
[f*] Correct!
[l]Mediator Proteins and Transcription Factors
[fx] No. Please try again.
[f*] Great!
[l]Promoter
[fx] No. Please try again.
[f*] Good!
[l]RNA polymerase
[fx] No, that’s not correct. Please try again.
[f*] Great!
[x][restart]
[/qwiz]
What’s next?
Proceed to Topics 6.5 – 6.6, Part 4: Eukaryotic Gene Regulation — Coordinated Control Mechanisms, and microRNAs (the next tutorial in AP Bio Unit 6).