1. Watch this Video
2. Study this Summary
Biodiversity and its Components
Biodiversity refers to the variety and variability of life within a given area. Biodiversity has three key components:
- Ecosystem Diversity – The variety of ecosystems within a region, such as mountains, meadows, and aquatic environments in Yellowstone National Park.
- Species Diversity – The number of different species present within an ecosystem.
- Genetic Diversity – The amount of genetic variation among individuals within a species.
Biodiversity and Resilience
Biodiversity increases resilience, which is an ecosystem’s ability to recover from disturbances. For example, a field of genetically uniform corn has low biodiversity and is highly vulnerable to pests or disease. In contrast, a diverse grassland with many species is more resistant to ecological disruptions.
Benefits of Biodiversity
- Intrinsic Value – Biodiversity has aesthetic, recreational, and cultural value.
- Direct Benefits. Many species contain compounds beneficial to medicine, such as the Pacific yew tree, which produces an anti-cancer compound. Without maintaining biodiversity, we’ll never experience these untold benefits of nature.
- Ecosystem Services – Biodiversity provides essential services, including:
- Oxygen production through photosynthesis.
- Carbon sequestration by oceans, helping to mitigate climate change.
- Natural pest control by species like insect-eating bats.
Measuring Biodiversity Using the Simpson Diversity Index
The Simpson Biodiversity Index uses two key metrics to assess biodiversity.
- Species Richness – The total number of species in an area.
- Species Evenness – How evenly individuals are distributed among different species.
When applied to different ecological communities, the index helps determine which community has the highest overall biodiversity.
Calculating the Simpson Diversity Index
The formula for calculating diversity using the Simpson Diversity Index is:
D = 1 – Σ(n/N)²
- D = diversity
- n = the number of individuals of a particular species
- N = the total number of individuals in the community
- Σ (sigma) represents summing the squared proportions of each species
Example: Comparing Three Communities
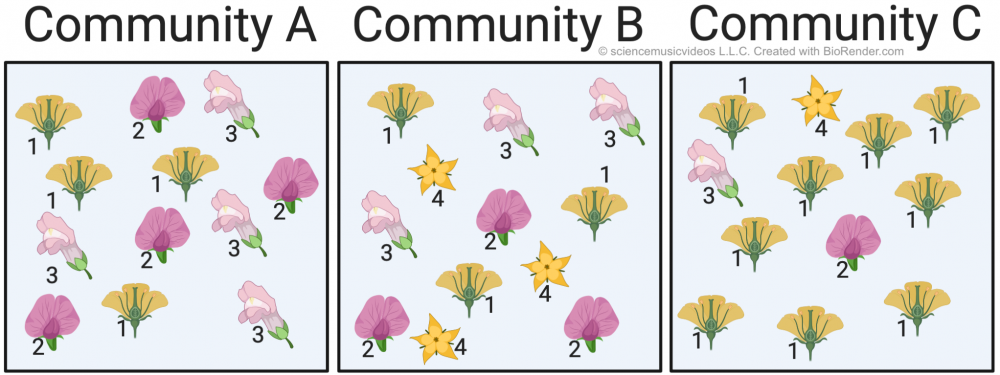
The image above shows three communities, each with a different number of species (species richness) and different numbers of individuals of each species (which relates to species evenness).
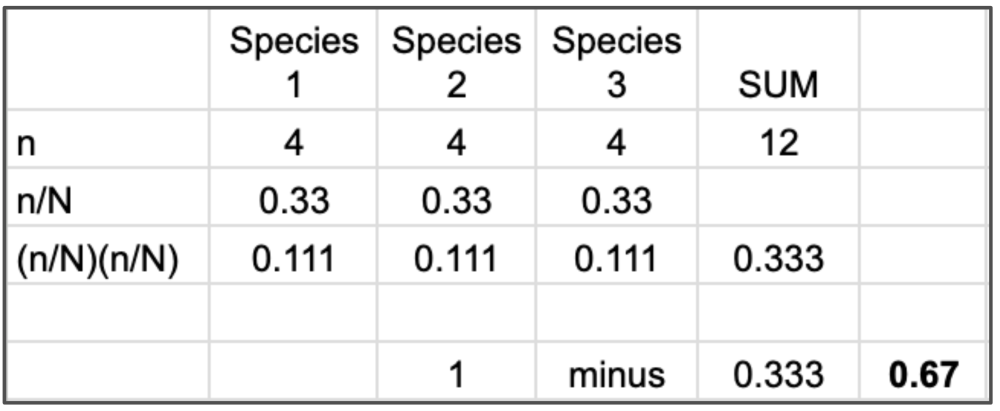
To calculate Diversity (D) for each community, follow these four steps for each community. We’ll use community A as an example.
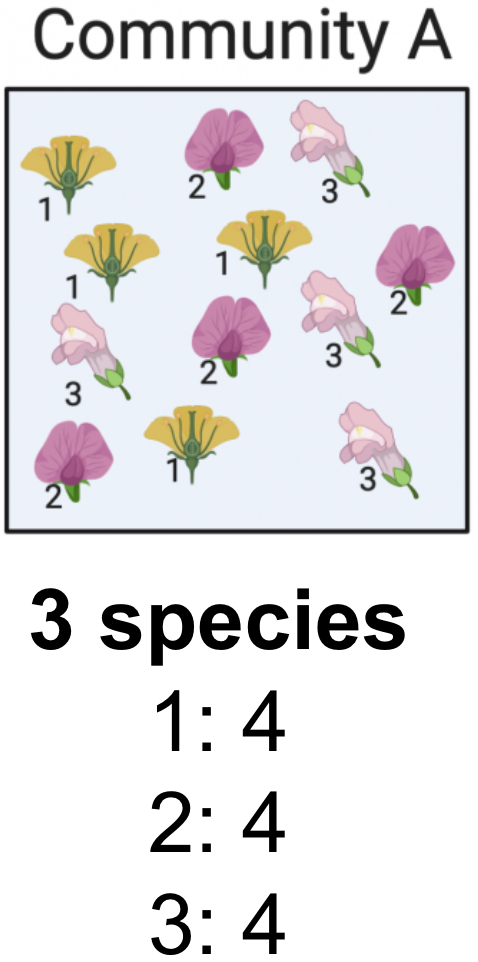
- Count the number of individuals of each species (n), and the total number of individuals of all of the species you’re analyzing. In community A there are 3 species, each with 4 individuals, so n= 4 for each species. There are a total of 12 individuals, so N = 12.
- For each species, divide n/N, and then square that: (n/N)²
- Add up each (n/N)²
- Subtract the sum (Σ) number from 1 to get D.
Here’s a table showing all of these operations for community A
Repeating these operations for communities B and C we find that
- Community B Index = 1 – 0.250 = 0.75
- Community C Index = 1 – 0.583 = 0.42
Interpreting the Results
- Community B has the highest diversity (0.75) due to high species richness and evenness.
- Community A has moderate diversity (0.67) with even species distribution but fewer species.
- Community C has the lowest diversity (0.42) due to one dominant species reducing evenness (even though its richness was equal to that of community B).
3. Master these Flashcards
[qdeck bold_text=”false” qrecord_id=”sciencemusicvideosMeister1961-Biodiversity Flashcards, APBioVideoPathway”]
[h]Biodiversity Flashcards
[i]
[q] Define “biodiversity,” and list the three major components of biodiversity.
[a] Biodiversity is “the variety of life.” Its three major components are genetic diversity, species diversity, and ecosystem diversity.
[q] What is genetic diversity, and why is genetic diversity advantageous to a population?
[a] Genetic diversity is the diversity of genes within a population’s gene pool. Populations that are genetically diverse have a lot of heterozygosity. Genetic diversity is advantageous because it makes a population more phenotypically diverse, which makes the population better able to adapt to change.
[q] Why is a lack of genetic diversity a potential problem for food crops?
[a] Populations that are genetically uniform have less phenotypic diversity, making them vulnerable to attack from parasites or pests.
[q json=”true” yy=”4″ unit=”8.Ecology” dataset_id=”AP_Bio_Flashcards_2022|10c0c3b4c8510″ question_number=”415″ topic=”8.5-6.Community_Ecology_and_Biodiversity”] What’s the relationship between ecosystem diversity and an ecosystem’s resilience to environmental change?
[a] Resilience is defined as an individual’s or a system’s ability to recover from adverse circumstances. In general, ecosystems with high diversity are more resistant to change than ecosystems with low diversity and more resilient in terms of their ability to recover from adverse conditions. Simpler ecosystems, with fewer species and less diversity within each species, are less able to adapt to changes in the environment. A field of corn in which every plant is a clone would represent the lowest possible diversity (only one species, with no diversity) and the lowest expected resilience.
[q json=”true” yy=”4″ unit=”8.Ecology” dataset_id=”AP_Bio_Flashcards_2022|10f6c0887f110″ question_number=”410″ topic=”8.5-6.Community_Ecology_and_Biodiversity”] The Simpson’s index of biodiversity is based on the relationship between species richness, the overall abundance of individuals, and the evenness of species distribution. Explain the meaning of each part of the index, and describe the conditions that lead to high species diversity.
[a] In Simpson’s index of biodiversity, species richness means the overall number of species in a specific area. Abundance is the number of organisms of all species. Evenness is how evenly distributed abundance is among the species living in a specific area.
For biodiversity to be high, an ecosystem needs to have high species richness, and the abundance of individuals within each species needs to be evenly distributed. For example, if there are 100 individuals of species A, 100 individuals of species B, and 10 individuals of species C, then evenness is lower than it would be if the number of individuals of each species was the same.
[x]
[restart]
[/qdeck]
4. Tackle these Quizzes
4.1. Biodiversity Quiz
[qwiz qrecord_id=”sciencemusicvideosMeister1961-Biodiversity Quiz, APBioVideoPath”]
[h]Biodiversity Quiz
[i]Biohaiku
These three components
Genes, species, ecosystems
Life’s diversity
[q] The variety of life: [hangman].
[c]IGJpb2RpdmVyc2l0eQ==[Qq]
[q] If a gene pool has many gene loci with multiple alleles, then we could say that the population has a lot of [hangman] diversity.
[c]IGdlbmV0aWM=[Qq]
[q] Genetic diversity leads to [hangman] (hint: it’s a word from genetics that begins with “p”) diversity. That’s important to natural selection because it makes a population capable of [hangman] to environmental change.
[c]IHBoZW5vdHlwaWM=[Qq]
[c]IGFkYXB0aW5n[Qq]
[q]Catastrophes like the Irish potato famine show how [hangman] diversity in food crops can be important to our system of agriculture. If crops lack this type of diversity, they can be wiped out by [hangman] infections, which is exactly what happened in Ireland in the 1840s.
[c]Z2VuZXRpYw==[Qq]
[c]cGFyYXNpdGlj[Qq]
[q]Here’s an easy question: What kind of diversity is defined by the number of species in a habitat, ecosystem, or entire planet: [hangman] diversity
[c]c3BlY2llcw==[Qq]
[q]The idea that nature is valuable in and of itself relates to the [hangman] value of biodiversity.
[c]aW50cmluc2lj[Qq]
[q]The fact that many potential medicines and crops are waiting to be discovered in natural systems is related to the [hangman] benefits of biodiversity.
[c]ZGlyZWN0[Qq]
[q]Regulation of the atmosphere, provision of water, and pollination are all examples of [hangman] [hangman].
[c]ZWNvc3lzdGVt[Qq]
[c]IHNlcnZpY2Vz[Qq]
[q mutiple_choice=”true”]The type of diversity that involves the variety of communities and habitats is
[c]Z2VuZXRpYyBkaXZlcnNpdHk=[Qq]
[f]Tm8uIEdlbmV0aWMgZGl2ZXJzaXR5IGlzIG1vcmUgcmVsYXRlZCB0byB0aGUgZXh0ZW50IG9mIGhldGVyb3p5Z29zaXR5IGluIGEgZ2VuZSBwb29sLg==[Qq]
[c]c3BlY2llcyBkaXZlcnNpdHk=[Qq]
[f]Tm8uIFNwZWNpZXMgZGl2ZXJzaXR5IGlzIHRoZSBudW1iZXIgb2Ygc3BlY2llcyBpbiBhIHJlZ2lvbiwgZWNvc3lzdGVtLCBvciBwbGFuZXQu[Qq]
[c]ZWNvc3lzdGVtIG RpdmVyc2l0eQ==[Qq]
[f]WWVzLiBUaGUgdmFyaWV0eSBvZiBjb21tdW5pdGllcyBhbmQgaGFiaXRhdHMgcmVsYXRlcyB0byBlY29zeXN0ZW0gZGl2ZXJzaXR5Lg==[Qq]
[q] Consider 3 communities of wildflowers, shown below as Communities A, B, and C. Which of the communities shown below has the lowest species richness (enter A, B, or C)?
[textentry single_char=”true”]
[c]IE E=[Qq]
[f]IE5pY2Ugam9iLiBDb21tdW5pdHkgQSBoYXMgdGhlIGxvd2VzdCBzcGVjaWVzIHJpY2huZXNzLiBUaGF0JiM4MjE3O3MgYmVjYXVzZSA=c3BlY2llcyByaWNobmVzcw==IGlzIGEgbWVhc3VyZSBvZiB0aGUgbnVtYmVyIG9mIHNwZWNpZXMgaW4gYSBjb21tdW5pdHkuIENvbW11bml0eSBBIGhhcyAzIHNwZWNpZXMgb2Ygd2lsZGZsb3dlcnMuwqAgQ29tbXVuaXRpZXMgQiBhbmQgQyBlYWNoIGhhdmUgNC4gSGVuY2UgQSBoYXMgdGhlIGxvd2VzdCByaWNobmVzcy4=[Qq]
[c]IEVudGVyIHdvcmQ=[Qq]
[c]ICo=[Qq]
[f]IE5vLiA=U3BlY2llcyByaWNobmVzcw==IGlzIGEgbWVhc3VyZSBvZiB0aGUgbnVtYmVyIG9mIHNwZWNpZXMgaW4gYSBjb21tdW5pdHkuIENvdW50IHRoZSBudW1iZXIgb2Ygc3BlY2llcyBpbiBlYWNoIGNvbW11bml0eSwgYW5kIGNob29zZSBhIGRpZmZlcmVudCBhbnN3ZXIu[Qq]
[q] Which of the communities shown below has the lowest species evenness?
[textentry single_char=”true”]
[c]IE M=[Qq]
[f]IEF3ZXNvbWUuIENvbW11bml0eSBDIGhhcyB0aGUgbG93ZXN0IHNwZWNpZXMgZXZlbm5lc3MuIFRoYXQmIzgyMTc7cyBiZWNhdXNlIA==c3BlY2llcyBldmVubmVzcw==IGlzIGEgbWVhc3VyZSBvZiBob3cgc2ltaWxhciB0aGUgc3BlY2llcyBpbiBhIGNvbW11bml0eSBhcmUgaW4gdGhlaXIgcmVsYXRpdmUgYWJ1bmRhbmNlLiBJbiBDb21tdW5pdHkgQywgdGhlcmUgYXJlIDkgaW5kaXZpZHVhbHMgb2Ygc3BlY2llcyAxOyBhbmQgMSBpbmRpdmlkdWFsIGZyb20gc3BlY2llcyAyLCAzLCBhbmQgNC4gVGhlIG90aGVyIGNvbW11bml0aWVzIGhhdmUgYSBtdWNoIG1vcmUgZXZlbiBzcHJlYWQgb2YgYWJ1bmRhbmNlIGZyb20gc3BlY2llcyB0byBzcGVjaWVzIChhbmQgYXJlIHRoZXJlZm9yZSBtb3JlIGV2ZW4pLg==[Qq]
[c]IEVudGVyIHdvcmQ=[Qq]
[c]ICo=[Qq]
[f]IE5vLiA=U3BlY2llcyBldmVubmVzcyBpcyBhIG1lYXN1cmUgb2YgaG93IHNpbWlsYXIgdGhlIHNwZWNpZXMgaW4gYSBjb21tdW5pdHkgYXJlIGluIHRoZWlyIHJlbGF0aXZlIGFidW5kYW5jZS7CoA==IENvdW50IHRoZSBudW1iZXIgb2YgZWFjaCB0eXBlIG9mIGZsb3dlciBpbiBlYWNoIGNvbW11bml0eSwgeW91JiM4MjE3O2xsIGZpbmQgdGhlIGFuc3dlci4=[Qq]
[q]The number of species in a community is that community’s species [hangman]. That’s why community A, with 3 species, is the community that’s lowest for this measure.
[c]cmljaG5lc3M=[Qq]
[q]The relative similarity of the number of individuals of each species in a community is referred to as species [hangman]. That’s why community C, with so many more individuals of species 1 than individuals of species 2, 3, or 4, is the community that’s lowest for this measure.
[c]ZXZlbm5lc3M=[Qq]
[x][restart]
[/qwiz]
5. Simpson Biodiversity Index Practice
5.1. Guided Practice
[qwiz style=”width: 800px !important; min-height: 400px !important;” qrecord_id=”sciencemusicvideosMeister1961-Simpson Index, Guided Practice, APBioVideoPath”]
[h]Simpson Index, Guided Practice
[i]A biologist has counted the number of individuals for each species in an community with 10 species. They’ve set up a data table. Help them complete their calculations. You’ll need to do your work on a separate sheet of paper.
[q]Step 1: For each species, divide n by N (the total number of individuals in the community). In this case, N = 100. Check your answer in the next card.
| Sp. A | Sp. B | Sp. C |
Sp. D | Sp. E |
Sp. F |
Sp. G | Sp. H | Sp. I |
Sp. J |
TOTAL (N) | |
| n | 68 | 9 | 3 | 4 | 1 | 3 | 4 | 3 | 2 | 3 | 100 |
| n/N | |||||||||||
| (n/N)2 |
[q]Step 2: For each species, take the value of n/N and square it. In other words, calculate (n/N)2.
| Sp. A |
Sp. B |
Sp. C |
Sp. D | Sp. E |
Sp. F |
Sp. G | Sp. H |
Sp. I |
Sp. J |
TOTAL (N) | |
| n | 68 | 9 | 3 | 4 | 1 | 3 | 4 | 3 | 2 | 3 | 100 |
| n/N | 0.68 | 0.09 | 0.03 | 0.04 | 0.01 | 0.03 | 0.04 | 0.03 | 0.02 | 0.03 | |
| (n/N)2 |
[q]Step 3: Add together all the values of (n/N)2.
| Sp. A |
Sp. B |
Sp. C |
Sp. D | Sp. E |
Sp. F |
Sp. G | Sp. H |
Sp. I |
Sp. J |
TOTAL (N) | |
| n | 68 | 9 | 3 | 4 | 1 | 3 | 4 | 3 | 2 | 3 | 100 |
| n/N | 0.68 | 0.09 | 0.03 | 0.04 | 0.01 | 0.03 | 0.04 | 0.03 | 0.02 | 0.03 | |
| (n/N)2 | 0.4624 | 0.0081 | 0.0009 | 0.0016 | 0.0001 | 0.0009 | 0.0016 | 0.0009 | 0.0004 | 0.0009 |
[q]Step 4: Subtract ∑(n/N)2 from 1.
| Sp. A |
Sp. B |
Sp. C |
Sp. D | Sp. E |
Sp. F |
Sp. G | Sp. H |
Sp. I |
Sp. J |
TOTAL (N) | |
| n | 68 | 9 | 3 | 4 | 1 | 3 | 4 | 3 | 2 | 3 | 100 |
| n/N | 0.68 | 0.09 | 0.03 | 0.04 | 0.01 | 0.03 | 0.04 | 0.03 | 0.02 | 0.03 | |
| (n/N)2 | 0.4624 | 0.0081 | 0.0009 | 0.0016 | 0.0001 | 0.0009 | 0.0016 | 0.0009 | 0.0004 | 0.0009 | 0.4778 |
[q]ANSWER: 1 – 0.4778 = 0.5222
[/qwiz]
5.2. Simpson Index Independent Practice
[qwiz style=”width: 800px !important; min-height: 400px !important;” qrecord_id=”sciencemusicvideosMeister1961-Simpson Diversity Index, Independent Practice, APBioVideoPath”]
[h]Simpson Diversity Index, Independent Practice
[q]A community has three species.
- Species A: 32 individuals
- Species B: 36 individuals
- Species C: 32 individuals
Set up your table. Fill in “n” and N for each species
[q] Here’s the table. Now complete the rest of the operations to calculate the Simpson Diversity Index.
| Sp. A | Sp. B | Sp. C |
TOTAL (N) | |
| n | 32 | 36 | 32 | 100 |
[c]IFtzaG93X21lX3Bs YWNlaG9sZGVyXQ==[Qq]
[f]
Cg==U3RlcHMgMi00
[Qq]| Sp. A |
Sp. B |
Sp. C |
TOTAL (N) | |
| n | 32 | 36 | 32 | 100 |
| n/N | 0.32 | 0.36 | 0.32 | |
| (n/N)2 | 0.1024 | 0.1296 | 0.1024 | 0.3344 |
Step 5: subtract ∑(n/N)2 from 1.
1 – 0.3344 = 0.6656
[/qwiz]
5.3. More Simpson Index Practice Problems
For each of the problems below, calculate the answer on your own. Then click “Show the Answer” to see if you got it right.
[qwiz style=”width: 800px !important; min-height: 400px !important;” qrecord_id=”sciencemusicvideosMeister1961-Simpson Diversity Index: More Practice Problems, APBioVideoPath”]
[h]Simpson Diversity Index: More Practice Problems
[q]PROBLEM 1: An ecologist in a study area in Redwood National Park gathers the following data.
| Redwoods | Douglas Firs | Western Hemlocks | Sitka Spruce |
| 84 | 90 | 7 | 42 |
Calculate the diversity index difference for this patch of forest.
[c]IFtzaG93X21lX3Bs YWNlaG9sZGVyXQ==[Qq]
[f]
Cg==| [Qq] | Redwoods | Douglas Firs | Western Hemlocks | Sitka Spruce | ||
| n | 84 | 90 | 7 | 42 | 223 | N |
| n/N | 0.38 | 0.40 | 0.03 | 0.19 | ||
| (n/N)2 | 0.14 | 0.16 | 0.00 | 0.04 | 0.34 | D |
Diversity index different = 1 – D = 1 – 0.34 = 0.66
[q]PROBLEM 2: An African Park contains the following array of mammals.
| Hyenas | Gazelles | Giraffes | Lions | Elephants | Wildebeest |
| 84 | 90 | 7 | 42 | 15 | 115 |
Calculate the diversity index for the mammals in this park.
[c]IFtzaG93X21lX3Bs YWNlaG9sZGVyXQ==[Qq]
[f]
Cg==| [Qq] | Hyenas | Gazelles | Giraffes | Lions | Elephants | Wildebeest | ||
| n | 84 | 90 | 7 | 42 | 15 | 115 | 353 | N |
| n/N | 0.24 | 0.25 | 0.02 | 0.12 | 0.04 | 0.33 | ||
| (n/N)2 | 0.06 | 0.07 | 0.0004 | 0.01 | 0.002 | 0.11 | 0.24 | D |
Diversity index difference = 1 – D = 1 – 0.14 = 0.76
[/qwiz]
What’s next?
Please proceed to our next tutorial: Ecosystem Disruption